State of Texas Plan
for Disaster Recovery:
Hurricane Harvey
PREPARED BY
THE TEXAS GENERAL LAND OFFICE
COMMUNITY DEVELOPMENT & REVITALIZATION PROGRAM
Section 421 of the Consolidated Appropriations Act, 2017 (Pub. L. 115-31, approved May 5, 2017)
JANUARY 18,
2018

Page 1 of 61
Table of Contents
I. Executive Summary ................................................................................................................................... 3
II. Needs Assessment .................................................................................................................................... 6
A. Cumulative Impact of Prior Disasters .................................................................................................. 6
B. Impact of Hurricane Harvey ................................................................................................................. 7
C. Resiliency Solutions and Mitigation Needs ....................................................................................... 11
D. Demographic Profile of Impacted Counties ....................................................................................... 13
E. Low to Moderate Income Analysis .................................................................................................... 15
F. Housing Impact ................................................................................................................................... 15
1. Real Estate Market .......................................................................................................................... 15
2. Homelessness .................................................................................................................................. 16
3. Social Services: 2-1-1 Texas Program ............................................................................................ 19
4. Interim Housing Assistance ............................................................................................................ 21
5. National Flood Insurance Program ................................................................................................. 22
6. Small Business Assistance (SBA) Disaster Home Loans ............................................................... 26
7. Public Housing Assistance (PHA) Data .......................................................................................... 28
8. FEMA Individual Assistance .......................................................................................................... 28
G. Infrastructure Impact .......................................................................................................................... 35
1. Governor’s Commission to Rebuild Texas ..................................................................................... 35
2. Texas Coastal Resiliency Study ...................................................................................................... 36
3. FEMA Public Assistance ................................................................................................................ 37
H. Economic Impact ............................................................................................................................... 38
1. Employment .................................................................................................................................... 38
2. Small Business Assistance (SBA) Business Disaster Loans ........................................................... 38
3. Agricultural Impacts ....................................................................................................................... 40
4. Tourism ........................................................................................................................................... 41
III. General Requirements ........................................................................................................................... 42
A. Public Housing, Affordable Housing, and Housing for Vulnerable Populations .............................. 42
B. Displacement of Persons and/or Entities ............................................................................................ 42
C. Maximum Assistance ......................................................................................................................... 43
D. Elevation Standards ............................................................................................................................ 43
E. Planning and Coordination ................................................................................................................. 43
F. Infrastructure Activities ...................................................................................................................... 44
G. Leveraging Funds ............................................................................................................................... 45

Page 2 of 61
H. Protection of People and Property...................................................................................................... 45
1. Quality Construction Standards ...................................................................................................... 45
2. Housing Contractors Standards ....................................................................................................... 45
I. Appeals Processes ................................................................................................................................ 45
K. Program Income ................................................................................................................................. 46
L. Monitoring Standards ......................................................................................................................... 46
M. Broadband Infrastructure ................................................................................................................... 47
IV. State Administered Disaster Recovery Program................................................................................... 48
A. Action Plan ...................................................................................................................................... 48
B. Program Budget .............................................................................................................................. 48
C. Use of Funds ................................................................................................................................... 49
1. Harris County Residential Buyout Program ............................................................................... 49
2. Harris County Partial Repair and Essential Power for Sheltering Program ................................ 50
3. Affordable Rental Recovery Program ......................................................................................... 50
D. Ineligible activities .......................................................................................................................... 51
E. Administrative Funds ...................................................................................................................... 51
F. Location .......................................................................................................................................... 51
G. Mitigation Measures ....................................................................................................................... 51
H. Use of Urgent Need ........................................................................................................................ 52
V. Citizen Participation ............................................................................................................................ 53
A. Public Website ................................................................................................................................ 53
B. Consultation .................................................................................................................................... 54
C. Consideration of Public Comments ................................................................................................ 56
D. Citizen Complaints .......................................................................................................................... 56
E. Substantial Amendment .................................................................................................................. 56
F. Non-substantial Amendment ........................................................................................................... 56
G. Waivers ........................................................................................................................................... 56
VI. Appendix A – CDBG-DR Eligible Counties ........................................................................................ 58
VII. Appendix B – Certifications ................................................................................................................ 59
Page 3 of 61
I. Executive Summary
The hurricane season of 2017 proved to be the most expensive in United States history, impacting
families from Puerto Rico to Florida and across the Texas coast. Hurricane Harvey made landfall
on August 25, 2017, between Port Aransas and Port O’Connor as a Category 4 hurricane with
sustained winds over 130 mph. After initial impact, Hurricane Harvey’s winds began to decrease,
but due to two high-pressure systems to the east and west, it remained fixed over the Texas coast
for the next 4 days. During this period, as much as 60 inches of rain fell over the impacted area.
The General Land Office (GLO) estimates
the cost of damages from Hurricane Harvey
at $160 billion, making it the costliest event
in U.S. history. The hurricane shut down
ports, trade, tourism, oil and gas production,
agricultural production, and general
businesses across most of the Texas coast,
including the fourth-largest city in the
nation for almost a week and, in some cases,
significantly longer. The impact of these
interruptions is difficult to quantify at this
time, but the effects of this disaster were felt
across the nation, with commodities such as
gas increasing in price by $0.33 a gallon in
the weeks following Hurricane Harvey.
1
Hurricane Harvey resulted in record rainfall
totals of 34 trillion gallons of water.
2
Combining this record rainfall together with
the fact that Hurricane Harvey made landfall twice creates a three-event narrative: the initial
landfall in Aransas County; the unprecedented rainfall in the Houston metroplex and surrounding
areas; and Hurricane Harvey’s second landfall which caused massive flooding in Southeast Texas.
Following these three events, tens of thousands of homes that had never been flooded took on
water, and evacuations continued for days after landfall.
1
U.S. Energy Information Administration. 2018. “Petroleum & Other Liquids.” Webpage accessed January 8,
2018. https://www.eia.gov/petroleum/gasdiesel/
2
San Antonio Express-News. September 17, 2017. “Harvey Dumped Record-Setting 34 Trillion Gallons of Rain.”
Webpage accessed January 10, 2018. http://www.expressnews.com/news/local/article/Harvey-dumped-record-
setting-34-trillion-gallons-12204769.php
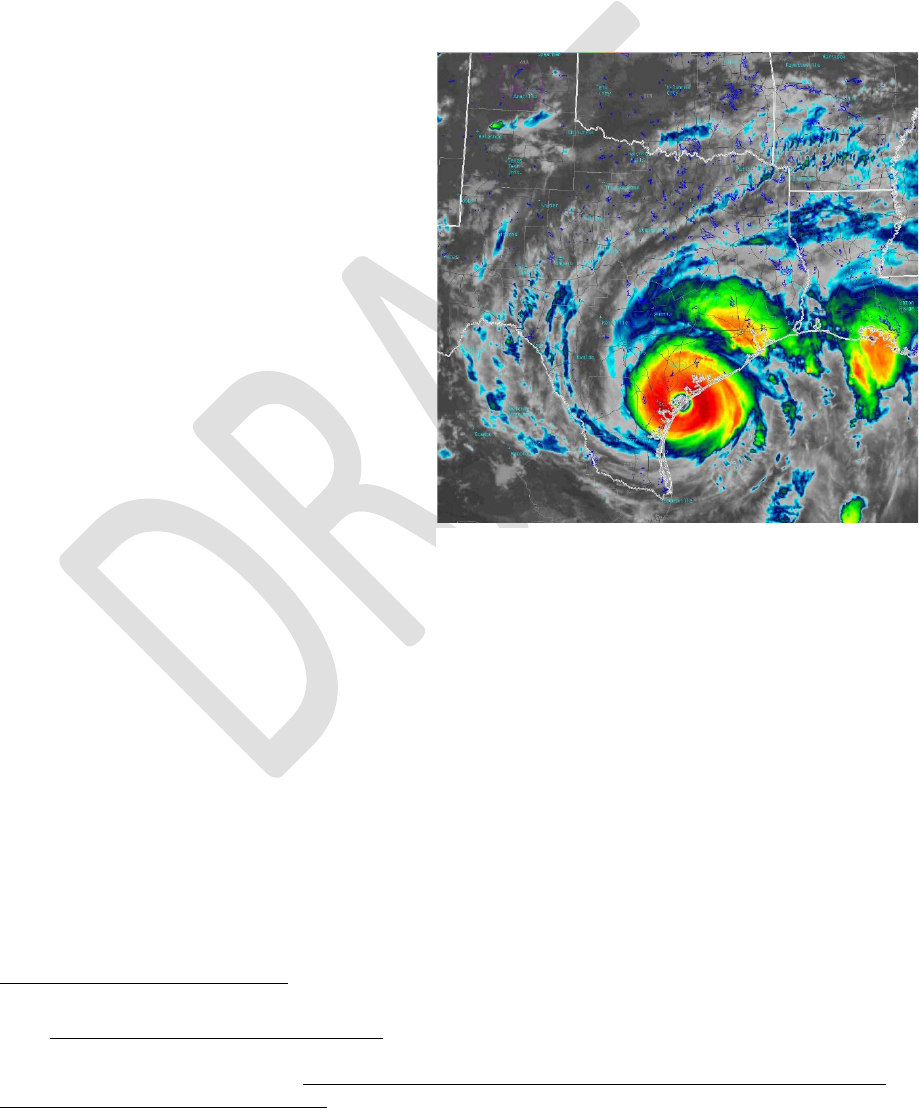
Weather.gov - Hurricane Harvey Satellite and Radar
Landfall Image
Page 4 of 61
The GLO estimates
over 1 million homes
were impacted by
Hurricane Harvey.
The state of Texas
has already spent
over $1 billion on
response and
recovery.
3
As of
December 15, 2017,
the Federal
Emergency
Management
Agency (FEMA)
Public Assistance
program estimates
damage costs related
to non-housing
categories at approximately $2.4 billion. As of December 7, 2017, the FEMA Individuals and
Households program received over 889,000 applications and has disbursed over $1.4 billion in
housing assistance and other related emergency disaster assistance. As of December 14, 2017,
FEMA’s National Flood Insurance Program received over 89,000 claims and disbursed more than
$3.4 billion to claimants. The Small Business Administration (SBA) has disbursed over $2.5
billion in home loans and $579 million in business loans as of December 7, 2017. This information
was provided to the GLO from FEMA and the SBA.
The U.S. Department of Housing and Urban Development (HUD) has allocated $57.8 million in
Community Development Block Grant Disaster Recovery (CDBG-DR) funds to the state of Texas
in response to Hurricane Harvey, FEMA-DR-4332, through the publication of the Federal
Register, Vol. 82, No. 247, Wednesday, December 27, 2017. This allocation is the remaining
amount from $400 million appropriated under Public Law 115-31 that allocated CDBG-DR funds
to Texas for the 2015 and 2016 flood events. The state of Texas is expected to receive additional
CDBG-DR allocations for long-term recovery from Hurricane Harvey. The GLO has been
designated by the governor to administer CDBG-DR funds on behalf of the state of Texas.
This Action Plan will detail the proposed use of all funds, including criteria for eligibility and how
the use of these funds will address long-term recovery and restoration of infrastructure, housing,
and economic revitalization in the most impacted and distressed areas. The use of funds for this
allocation is limited to unmet recovery needs from Hurricane Harvey, DR- 4332.
HUD has identified Harris County as the “most impacted and distressed” area in the Federal
Register notice and has required that at least 80 percent of the allocation must address unmet needs
within the County. The remaining 20 percent will address unmet needs within the “most impacted
3
The Texas Tribune. 2017. “How Much has been Raised for Harvey Relief – and How’s it Being Spent.”
Webpage accessed December 2, 2017. https://www.texastribune.org/2017/11/28/how-much-money-going-hurricane-
harvey-relief-texas/
Source: www.weather.gov
Page 5 of 61
and distressed” areas determined by the GLO through the unmet needs assessment in Section II of
this Action Plan. The GLO has allocated the remaining portion of these initial funds to Aransas,
Nueces, and Refugio Counties. Section IV of this Action Plan will outline the budget, the use of
funds, and criteria for eligibility.
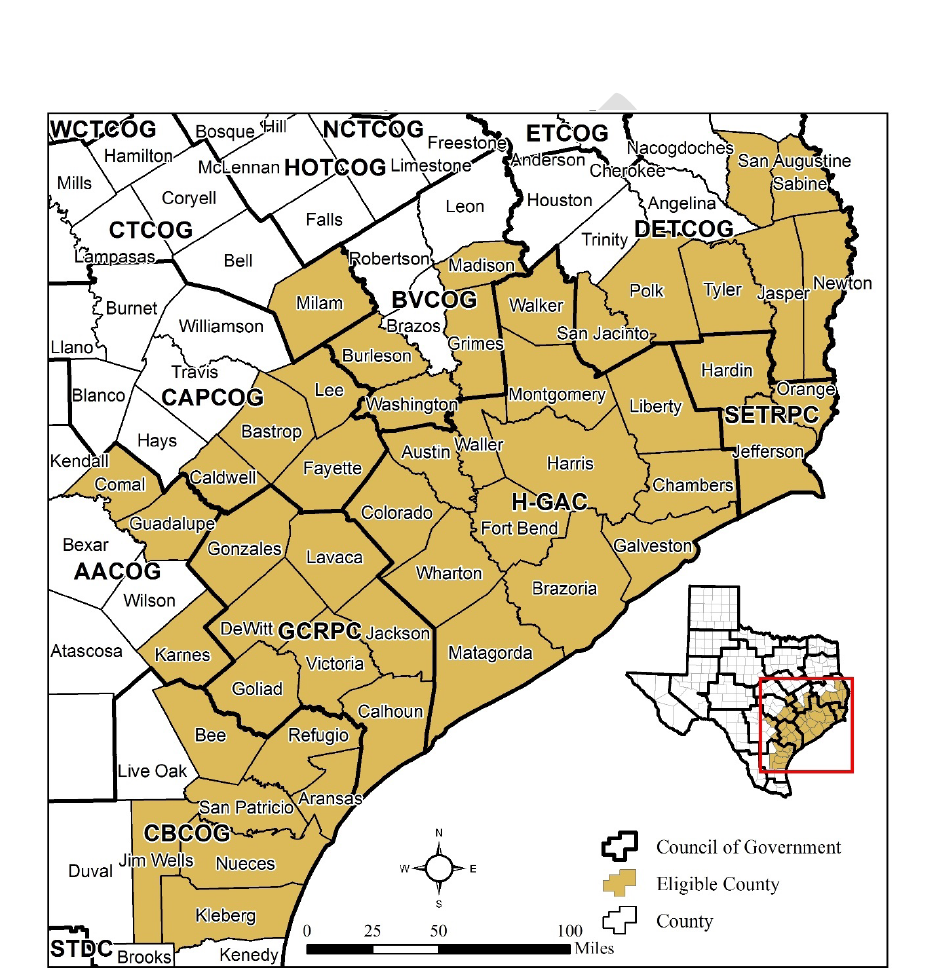
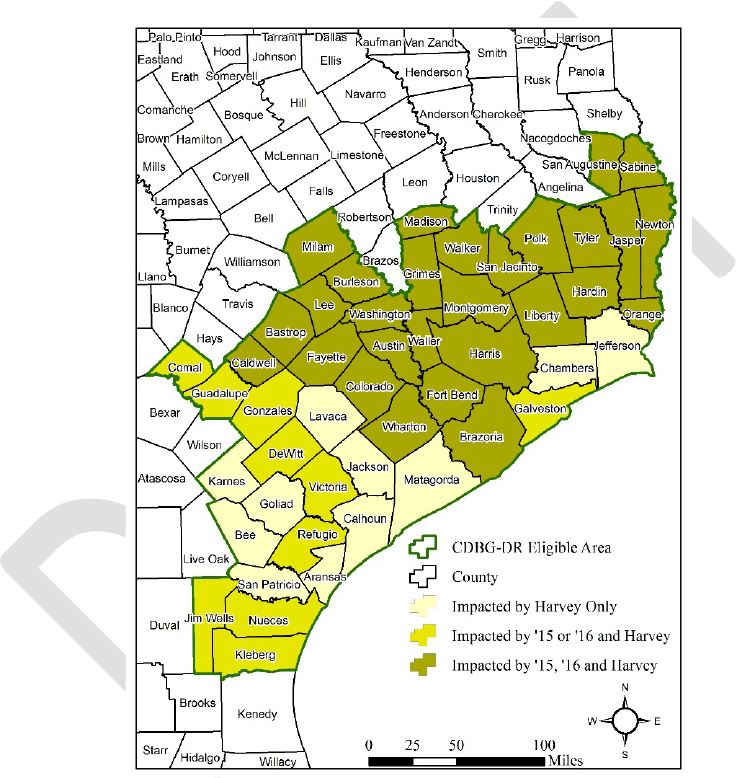
For the purpose of this Action Plan, the four counties (Bexar, Dallas, Tarrant, and Travis) that
received FEMA disaster declarations for emergency protective measures only (Category B),
including direct federal assistance under the Public Assistance program, are not included in the 49
CDBG-DR eligible counties identified on the map below.
Figure 1: DR-4332 49 CDBG-DR Eligible Counties

Page 6 of 61
II. Needs Assessment
The State of Texas completed the following needs assessment to identify long-term needs and
priorities for CDBG-DR funding allocated as a result of Hurricane Harvey. This assessment takes
into account a comprehensive set of data sources that cover multiple geographies and sectors and
was completed according to guidelines set forth by the U.S. Department of Housing and Urban
Development (HUD) in Federal Register, Vol. 82, No. 247, Wednesday, December 27, 2017. The
information focuses on the statewide impacts and the impacts on the 49 CDBG-DR eligible
counties (see list in Appendix A), as well as Harris County—the most impacted and distressed
county—as identified by HUD in the Federal Register. The information for the assessment was
compiled using federal and state sources, including information from FEMA, HUD, TDEM, SBA,
Health and Human Services Commission (HHSC) and other federal and state agencies. The GLO
was able to work with these agencies to gather the most up-to-date information regarding the
impacts of the hurricane, actions taken during and following the storm, and unmet need.
This needs assessment includes specific details about unmet needs within the eligible and most
impacted and distressed communities. This includes details for housing, infrastructure, and
economic revitalization. This assessment will take into consideration pre-disaster needs, in
addition to needs resulting from Hurricane Harvey. It will also discuss additional types of
assistance that may be available to affected communities and individuals, such as insurance, other
federal assistance, or any other possible funding sources. Taking the above into consideration,
mitigation and resiliency measures to protect against future hazards will also be examined. This
needs assessment is expected to be amended as additional information is available or updated.
A. Cumulative Impact of Prior Disasters
The state of Texas is vulnerable to various extreme weather events. Recently, Texas experienced
a historic drought that began in 2010. According to the Office of the State Climatologist, the driest
12-month period on record for Texas was October 2010 to September 2011, with a statewide
average of only 11.18 inches of rain. This led to catastrophic wildfires that lasted from November
15, 2010, through October 31, 2011. A total of 3.9 million acres and approximately 5,900
structures were damaged and/or destroyed during this wildfire season. Many factors contributed
to this record-breaking season, including the La Niña weather pattern that caused extreme drought
conditions, high winds from Tropical Storm Lee, and unprecedented high temperatures. These
weather conditions, combined with the availability of large amounts of dry fuels that had built up
over 5 years of drought, led to the intensity of these wildfires.
The extended drought that Texas experienced made the state susceptible not only to wildfires but
to flash flooding as well. These drought factors contributed to the inability of soils to effectively
absorb water runoff. The 2011 wildfires also removed vegetation that usually work to slow down
and absorb rainfall.
In 2015 and 2016, the state received record amounts of rain—not once but multiple times. This
resulted in six Federal disaster declarations spread over 160 of the state’s 254 counties. The critical
infrastructure damage and already saturated grounds from the 2015 floods greatly enhanced the
Page 7 of 61
devastation experienced by counties during the 2016 floods. These multiple events caused multiple
human fatalities and did severe damage across nearly half the state, or 134,000 square miles. To
date, the state of Texas still estimates $2 billion in unmet need from these events.
The below map highlights the counties that have been impacted by the last 3 years of disasters.
The majority of counties in the eligible area have been impacted by disasters in each of the last
three years. This further demonstrates the compounding impacts of recent disasters in Texas and
the impacts that these disasters are having on housing, infrastructure, and local economies along
the coast.
Figure 2: Hurricane Harvey CDBG-DR Eligible Counties Impacted by 2015 Floods, 2016 Floods
and Harvey Declarations
B. Impact of Hurricane Harvey
In 2017, communities that had not yet had a chance to fully recover from the 2015 and 2016 floods
were impacted again. Hurricane Harvey, a regenerated tropical depression, made landfall on
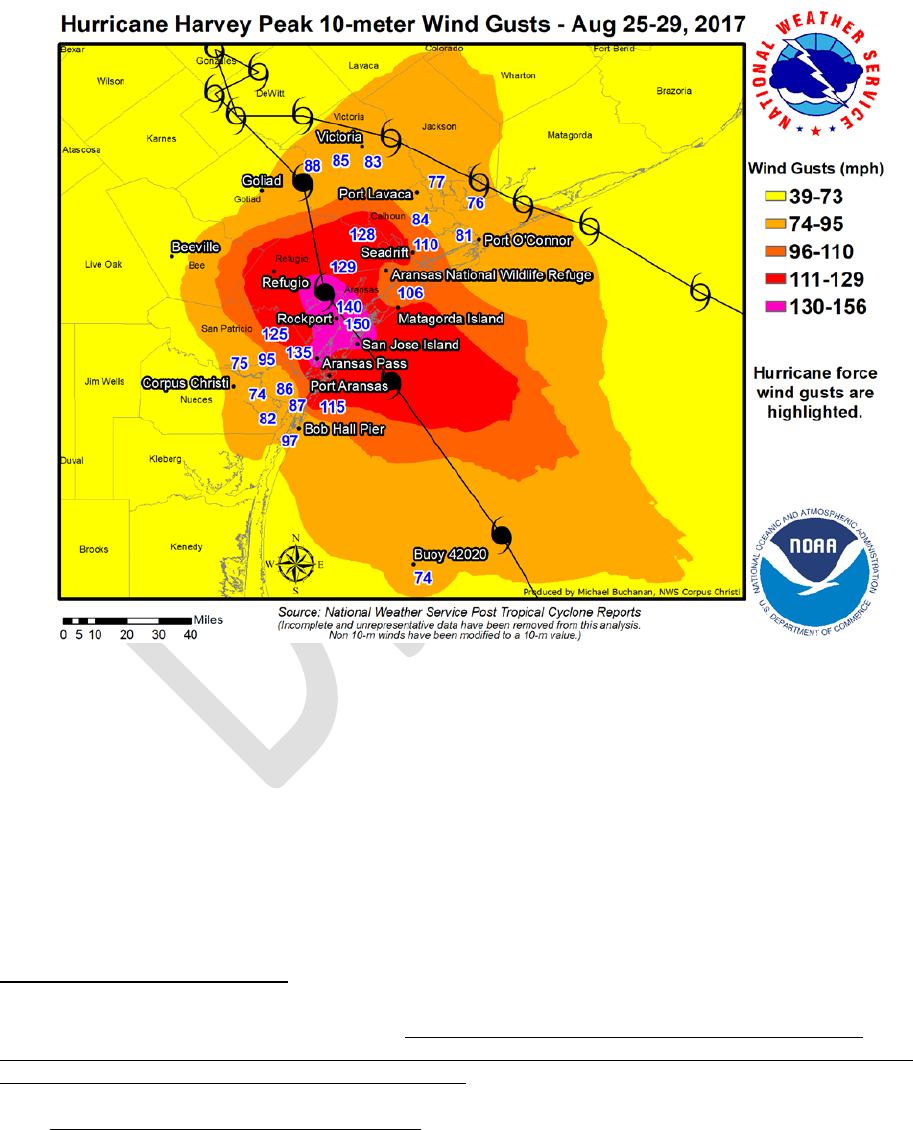
August 25, 2017, as a Category 4 hurricane, bringing with it extreme wind gusts and, in some
places, up to 60 inches of rain in 5 days. The hurricane caused catastrophic flooding and at least
Page 8 of 61
82 human fatalities,
4
due in part to the weather system stalling over the Texas coast. The
windspeeds recorded over South Texas may have been underestimated, especially near the coast
and close to the eyewall of Hurricane Harvey, as many observation stations were disabled prior to
landfall of the eye of the hurricane. However, a peak wind gust of 150 mph was reported near
Rockport.
5
Figure 3: Hurricane Harvey Peak Wind Gusts
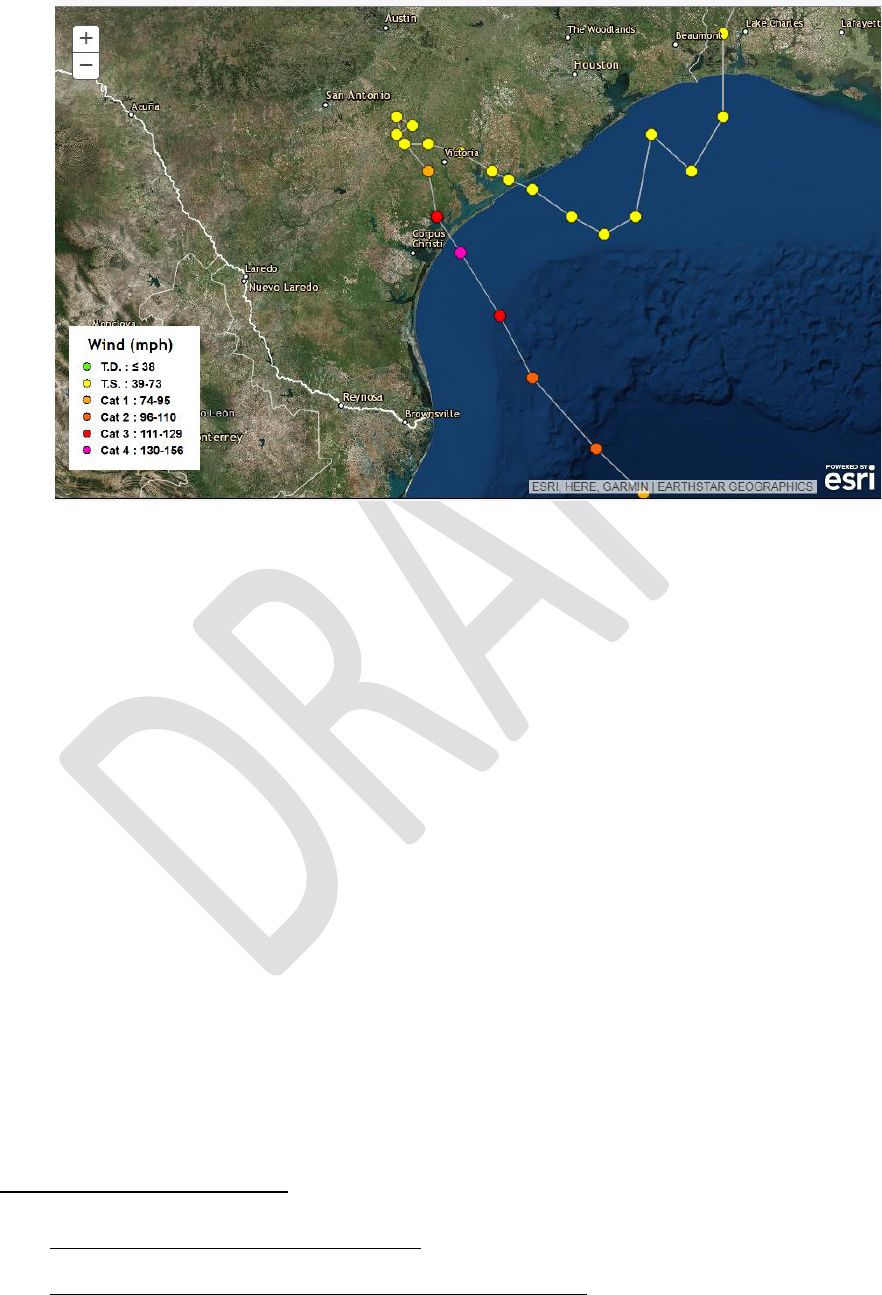
Hurricane Harvey made landfall twice and is viewed by many as three separate events: the initial
landfall in Aransas County; unprecedented rainfall in the Houston metroplex and surrounding
areas; and the second landfall on August 29, 2017, in southeast Texas near the cities of Orange,
Beaumont, and Port Arthur. These events caused not only wind damage, but also widespread
flooding.
4
The Washington Post. “Texas officials: Hurricane Harvey death toll at 82, ‘mass casualties have absolutely not
happened.’” Webpage accessed January 10, 2018. https://www.washingtonpost.com/national/texas-officials
-hurricane-harvey-death-toll-at-82-mass-casualties-have-absolutely-not-happened/2017/09/14/bff3ffea-9975-11e7
-87fc-c3f7ee4035c9_story.html?utm_term=.dfe744e2fbe8
5
National Weather Service. “Major Hurricane Harvey - August 25-29, 2017.” Webpage accessed January 10,
2018. http://www.weather.gov/crp/hurricane_harvey
Page 9 of 61
Figure 4: Track of Hurricane Harvey
6
The 49 CDBG-DR eligible counties affected by Hurricane Harvey cover 15 percent or 39,496
square miles of land area in the state and contain approximately 32 percent of the state’s
population. The land area affected is roughly the size of the state of the Kentucky.
7
Nearly 8.9
million Texans live in the affected counties.
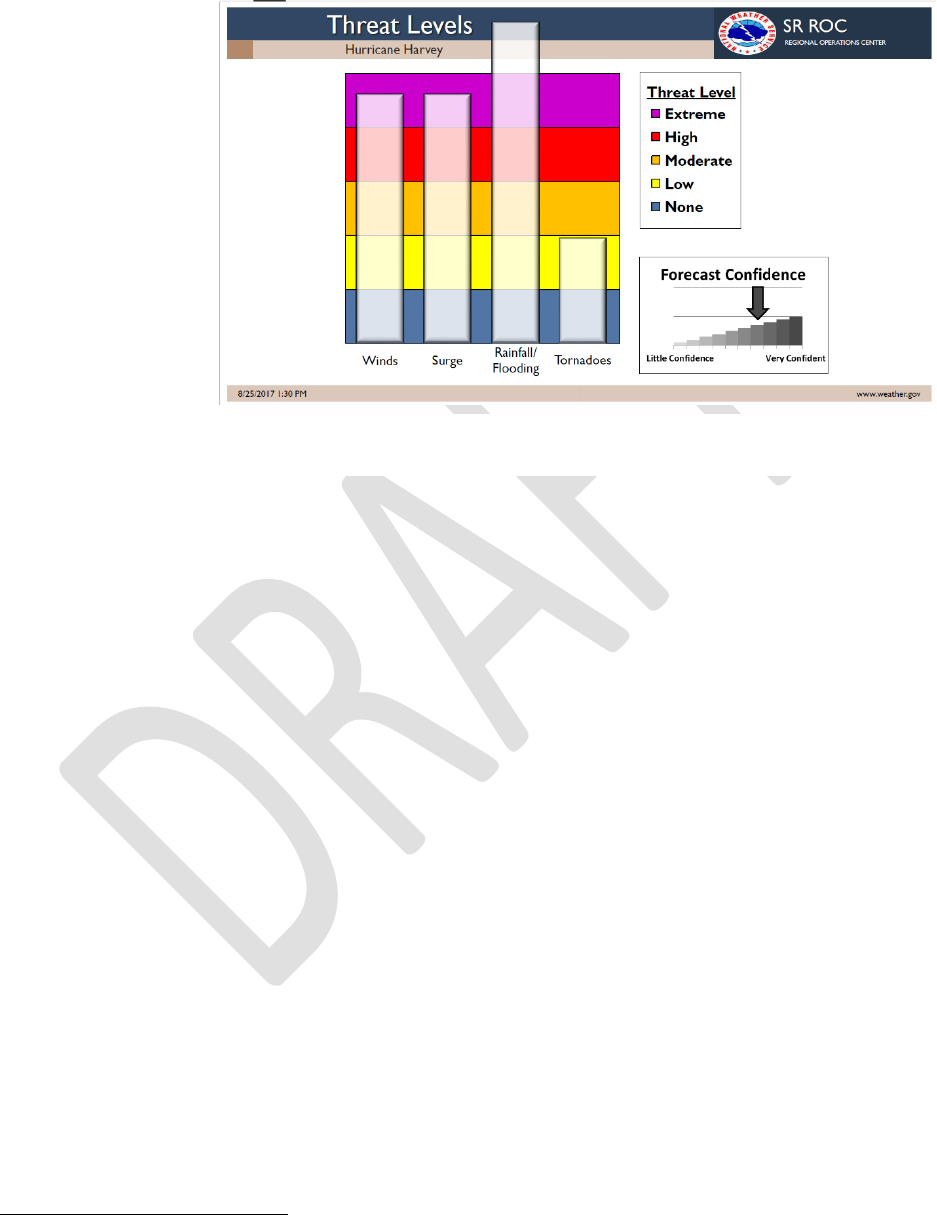
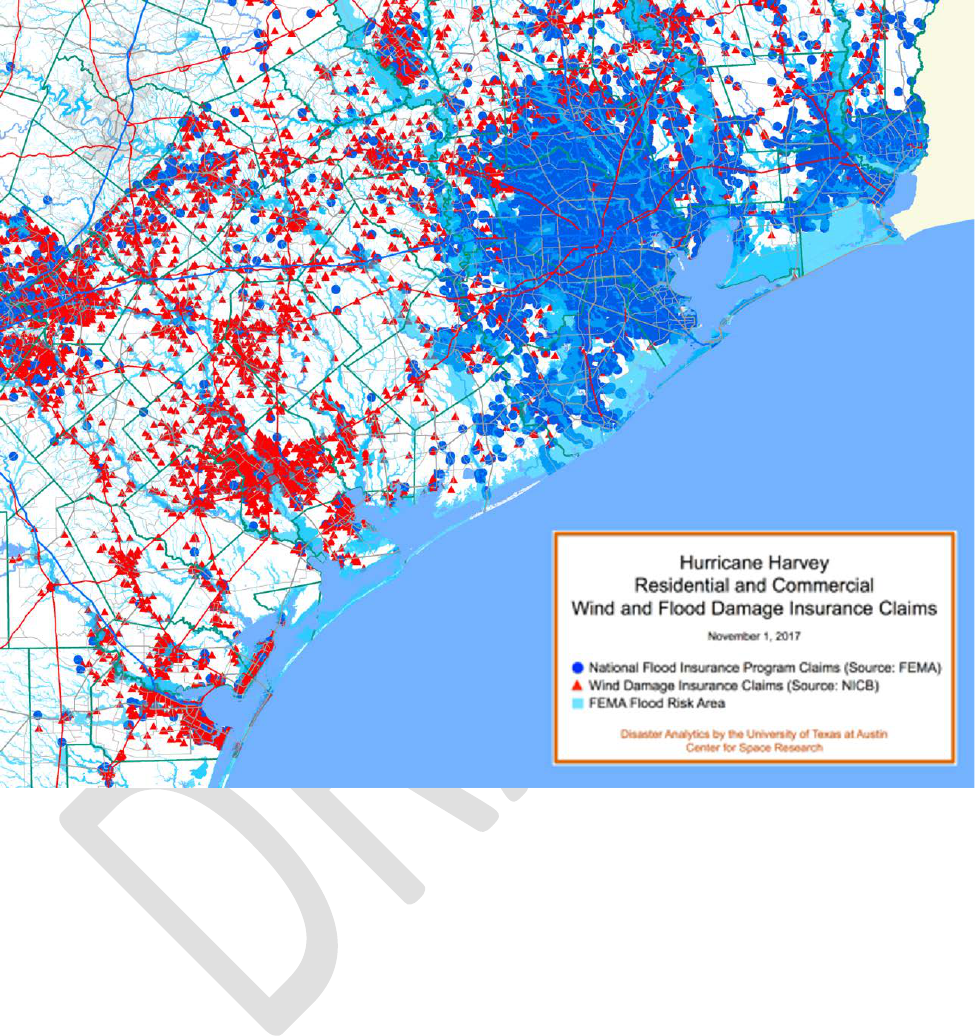
As can be seen in the following map, the initial landfall caused severe wind damage
(demonstrated by the number of windstorm damage insurance claims in red). This map also
portrays the extent of National Flood Insurance Program (NFIP) claims in the northern section of
the coast, where storm rains caused severe flooding in Houston and the surrounding areas. This
graphic further demonstrates the two catastrophic characteristics of Hurricane Harvey: (1)
hurricane-force winds and (2) a slow-moving storm bringing historic rainfall and flooding.
6
National Weather Service. “Major Hurricane Harvey - August 25-29, 2017.” Webpage accessed January 10,
2018. http://www.weather.gov/crp/hurricane_harvey
7
The United States Census Bureau. “QuickFacts Kentucky; UNITED STATES.” Webpage accessed January 10,
2018. https://www.census.gov
/quickfacts/fact/table/KY,US/LND110210
Page 10 of 61
Figure 5: Residential and Commercial Windstorm and Flood Damage Insurance Claims
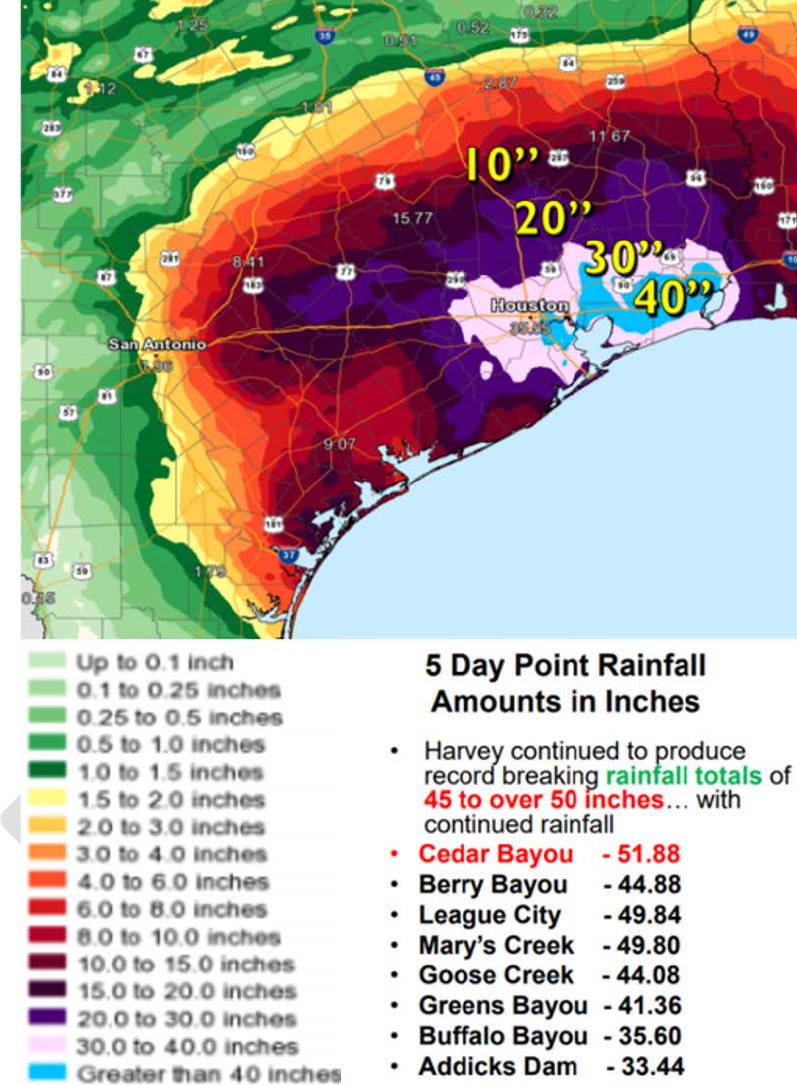
By the time the rain stopped, Hurricane Harvey had dumped almost a year’s worth of rainfall in
just a few days. So much rain fell during the hurricane that the National Weather Service had to
update the color charts on their graphics in order to effectively map it. Two additional shades of
purple were added to represent rainfall totals for 20-30 inches and “greater than 30 inches” ranges.
Page 11 of 61
Figure 6: National Weather Service’s 5 Day Point Rainfall in Inches
C. Resiliency Solutions and Mitigation Needs
Recognizing the state’s long and well-documented history of flooding, hurricanes, wildfires, and
droughts, as well as its ongoing efforts to mitigate future disaster effects in its most vulnerable

Page 12 of 61
areas, the GLO continues its commitment to rebuilding while prioritizing resiliency. In assessing
unmet needs, it is important to consider the additional costs of safeguarding housing and
community infrastructure investments from future disasters. As such, Texas will not only assess
projects and consider state-run programs that replace or repair lost property but will also seek to
invest resources in efforts that promise to mitigate damage from a wide range future disaster types.
Although this can increase costs initially, mitigating efforts can greatly reduce the cost of future
damages. The success of this long-term recovery practice was seen firsthand during Hurricane
Harvey. Resilient-enhanced projects from previous CDBG-DR efforts suffered less damage from
Hurricane Harvey: construction projects designed to prevent future flooding, mitigate further loss,
and decrease evacuation times.
Single family home resiliency solutions are expected to add approximately 10 to 15 percent to the
total cost per home; multifamily resiliency solutions add 15 to 20 percent to the total cost per
project; and infrastructure resiliency solutions add 15 to 20 percent to the total cost per project.
Resiliency solutions are varied and dependent on the respective area’s Threat and Hazard
Identification and Risk Assessment (THIRA).
Single family home resiliency solutions may include elevating the first floor of habitable area;
breakaway ground floor walls; reinforced roofs; storm shutters; use of ENERGY STAR appliances
and fixtures; and mold and mildew resistant products. Multifamily resiliency solutions include
elevation; retention basins; fire-safe landscaping; firewalls; and landscaped floodwalls.
Buyout programs support hazard mitigation, floodplain management goals, and resiliency by
removing homeowners from the floodplain, thus eliminating vulnerability to future flooding
situations. After homes are purchased, the structures are demolished or relocated. The land reverts
to a natural floodplain, converts into a retention area, or is retained as green space for recreational
purposes. The buyout option serves multiple objectives and provides a resiliency option versus
rebuilding within a floodplain. Buyouts help prevent repetitive loss and extreme risk to human
health and safety. Buyouts conducted sooner rather than later prevent homeowners from making
repairs and investing funds in properties that they then may not want to sell.
In the case of infrastructure resiliency solutions, improvements may include:
• Elevating critical systems, facilities, and roadways above base flood elevation;
• Installing backup power generators for critical systems (water, sewer, etc.);
• Avoiding an increase in impervious cover by keeping projects in their original footprint
and encouraging the use of building practices that allow for more pervious coverage, when
possible;
• Replanting with only native vegetation to preserve the natural environment;
• Installing retention basins, larger culverts and debris guards, erosion control solutions, and
back-up communication systems; and
• Supporting local community efforts to enhance building codes and regulations.
The resiliency multiplier will be a standard 15 percent for both housing and infrastructure activities
to calculate unmet need, as has previously been applied in other Texas CDBG-DR programs.

Page 13 of 61
D. Demographic Profile of Impacted Counties
The demographic profile data was generated using a wide range of data sets from the U.S. Census
Bureau, unless otherwise noted. The 49 CDBG-DR eligible counties affected by Hurricane Harvey
cover 15 percent, or 39,496 square miles of the state, and contain approximately 32 percent of the
state’s population. This equals nearly 8.9 million Texans living in the eligible counties. These
counties have seen almost a 1 million person, or 12 percent, increase from 2010 to 2016.
Of the 3.4 million housing units in the eligible counties, 62.5 percent are owner-occupied units.
Some housing and income demographics are slightly different in the eligible counties versus the
statewide averages. The 49 eligible counties have an estimated median owner-occupied housing
unit value and median household income lower than the state as a whole. The median value of
owner-occupied housing units is $105,800—almost $37,000 less than the statewide median value
of $142,700. The 49 eligible counties have a median household income of $50,145 – $4,582 less
than the statewide average of $54,727. In addition to a lower median household income, the per
capita income is also lower than the state as a whole. Approximately 14.9 percent of the population
in the 49 eligible counties is living in poverty. This is just less than the statewide average of 15.6
percent.
By percentage, the 49 eligible counties have a higher African-American population when
compared to the state as a whole. The 49 eligible counties have a 16.27 percent African-American
population—approximately 3.67 percent higher than the statewide total. The minority population
as a whole in all 49 eligible counties is approximately 62.21 percent—2.7 percent higher than the
statewide total.
In the 49 eligible counties, veterans account for 4.9 percent of the population; the elderly account
for approximately 11.73 percent; and disabled persons under the age of 65 account for 7.65 percent
of the population. These numbers are in line with state averages.
Table 1: 2016 Demographic Statistics for Texas and the 49 CDBG-DR Eligible Counties from
the U.S. Census Bureau
Texas
49 CDBG-DR Eligible
Counties
Fact Estimates Estimates
Percent of
Area
Population estimates, 2016 27,862,596 8,861,831
32% of
Texas
Population
Population, percent change - April 1, 2010,
(estimates base) to July 1, 2016
10.80% 12%
Persons under 5 years, percent, 2016 7.20% 645,145
7.28% of
Eligible
Population

Page 14 of 61
Texas
49 CDBG-DR Eligible
Counties
Fact Estimates Estimates
Percent of
Area
Persons under 18 years, percent, 2016 26.20% 2,319,282
26.17% of
Eligible
Population
Persons 65 years and over, percent, 2016 12.00% 1,039,153
11.73% of
Eligible
Population
White alone, percent, 2016
79.40%
6,593,176
74.40%
Black or African American alone, percent,
2016
12.60% 1,441,957 16.27%
American Indian and Alaska Native alone,
percent, 2016
1.00% 88,954 1.00%
Asian alone, percent, 2016
4.80%
565,728
6.38%
Native Hawaiian and Other Pacific Islander
alone, percent, 2016
0.10% 8,875 0.10%
Two or More Races, percent, 2016
1.90%
163,599
1.85%
Hispanic or Latino, percent, 2016
39.10%
3,244,050
36.61%
White alone, not Hispanic or Latino, percent,
2016
42.60% 3,558,315 40.15%
Housing units, 2016
10,753,629
3,444,036
Owner-occupied housing unit rate, 2012-
2016
61.90% 2,152,669
62.5% of
Housing
Units
Median value of owner-occupied housing
units, 2012-2016
$142,700 $105,800
Median gross rent, 2012-2016
$911
$777
With a disability, under age 65 years,
percent, 2012-2016
8.10% 678,268
7.65% of
Eligible
Population
Median household income (in 2016 dollars),
2012-2016
$54,727 $50,145
Persons in poverty, percent 15.60%
14.9% of
Eligible
Population
Land area in square miles, 2010 261,231.71 39,496
15% of
Texas
Page 15 of 61
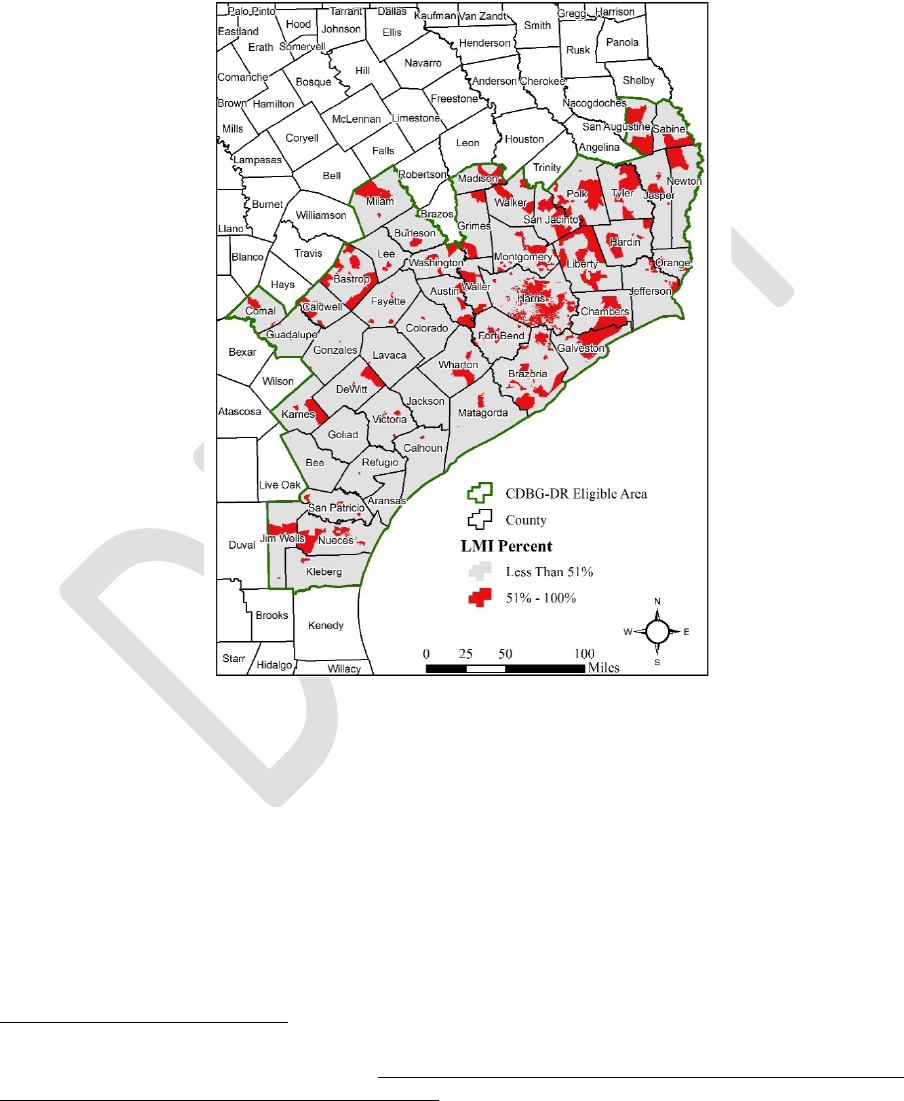
E. Low to Moderate Income Analysis
The following map identifies census block groups that have a low- to moderate-income population
of 51 percent or more for the 49 eligible counties using HUD’s 2017 Low and Moderate Income
Summary Data (LMISD) for the state of Texas.
8
Figure 7: Percentage of LMI Population by Block Group
F. Housing Impact
1. Real Estate Market
The housing real estate market in Texas remains strong with a high housing demand and a tight
supply. As stated by Texas A&M’s Real Estate Center’s August 2017 report prior to Hurricane
Harvey, the months of inventory of Texas houses increased to 3.9 months for the first time
since 2014; this indicates strong housing demand and tight supply. Around 6 months of
inventory is considered a balanced housing market. Texas housing affordability continues to
8
HUD Exchange. “FY 2017 LMISD by State - All Block Groups, Based on 2006-2010 American Community
Survey.” Webpage accessed January 10, 2018. https://www.hudexchange.info/programs/acs-low-mod-summary-
data/acs-low-mod-summary-data-block-groups-places/

Page 16 of 61
worsen due to limited supply for homes under $300,000, along with increasing construction
costs.
9
In an already tight market, the loss of housing associated with Hurricane Harvey only
compounds affordability issues in the state.
The housing markets on the Gulf Coast dipped substantially in August due to Hurricane
Harvey; however, the market saw a large rebound in September. Housing sales that were
delayed because of Hurricane Harvey in August caused a 2.6 percent increase in September,
as those sales were executed post-storm. Third quarter increases in vacant, developed lots also
generated a 5.4 percent monthly increase in single family housing construction permits. This
increase was directly related to recovery efforts in places like Houston.
10
2. Homelessness
Based on the assessment regarding pre-disaster homeless persons and the GLO’s work with
other state agencies and organizations, the state is working to address the needs of pre-disaster
homeless persons.
In January 2017, Texas accounted for 4.25 percent of the nation’s total homeless population.
However, given the size and population of the state, Texas has seen one of the largest decreases
(30.8 percent decline) in homelessness from 2012 to 2017. The point-in-time count revealed
that 23,548 persons in the state were physically counted as homeless in January 2017.
11
From
January 2016 to January 2017, there was a slight increase of 1.8 percent in the Texas total
homeless population.
The HUD 2017 Continuum of Care data reports 29.05 percent of the total homeless population
in the state is comprised of households with one adult and at least one child under the age of
18 years.
12
A Continuum of Care (CoC) is the group of representatives that takes on the coordination of
homeless services and homelessness prevention activities across a specified geographic area
and that implements community-wide, coordinated efforts for assessing and addressing the
housing and service needs of individuals and families that are homeless or at risk of
homelessness.13 The following map shows the CoCs operating in Texas.
9
Texas A&M Real Estate Center. “Outlook for the Texas Economy.” Webpage accessed January 10, 2018.
https://www.recenter.tamu.edu/articles/technical-report/outlook-for-the-texas-economy
10
Texas A&M Real Estate Center. “November 2017 Housing Reports by MSAs.” (data as of October 31, 2017)
11
HUD Exchange. “2007 – 2017 Point – Time Counts by CoC.” Webpage/Excel document accessed January 10,
2018. https://www.hudexchange.info/resources/documents
/2007-2017-PIT-Counts-by-CoC.xlsx
12
HUD Exchange. “2017 Continuum of Care Homeless Assistance Programs Homeless Populations and
Subpopulations.” Webpage accessed January 10, 2018. https://www.hudexchange.info/resource/reportmanagement
/published/CoC_PopSub_State_TX_2017.pdf
13
TDHCA. “Continuum of Care.” Webpage accessed January 10, 2018. https://www.tdhca.state.tx.us
/tich/coc.htm

Page 17 of 61
(a) State Homeless Support Services
Texas has a fairly widespread and robust homeless support services program. The GLO
actively coordinates and collaborates with localities and nonprofits to comprehensively
address pre-disaster homelessness separately from CDBG-DR funding.
The Texas Homeless Network is a statewide nonprofit organization funded in part by the
Texas Department of Housing and Community Affairs (TDHCA) and the Texas
Department of State Health Service (DSHS). The Texas Homeless Network provides
training and technical assistance around the state to help service providers and communities
better serve the homeless population with the end goal of preventing and ending
homelessness.
14
TDHCA’s Homeless Housing and Services Program (HHSP) provides funding to the eight
largest cities in support of services to homeless individuals and families. The cities
currently served through HHSP are Arlington, Austin, Corpus Christi, Dallas, El Paso, Fort
Worth, Houston, and San Antonio. For fiscal years 2015, 2016, and 2017, $15 million has
been allocated to HHSP. The allowable activities include construction, development, or
procurement of housing for homeless persons; rehabilitation of structures targeted to
serving homeless persons or persons at risk of homelessness; provision of direct services
and case management to homeless persons or persons at risk of homelessness; or other
homelessness-related activities.
The Emergency Solutions Grants (ESG) program, formerly the Emergency Shelter Grants
Program, is a competitive grant that awards funds to private nonprofit organizations, cities,
and counties in the state of Texas to provide the services necessary to help persons that are
at risk of homelessness or homeless quickly regain stability in permanent housing. The
ESG program is funded by HUD and is administered by TDHCA. In 2016 and 2017,
TDHCA has awarded over $17 million to eligible subrecipients battling homelessness
across the state.
The Texas HOME Disaster Relief program is administered by TDHCA. The program is
available to local governments, nonprofit organizations, and public housing authorities
within a federal or state-declared county to serve households earning at or below 80 percent
Area Median Family Income (AMFI). Eligible activities include the HOMEowner
Rehabilitation Assistance Program, Tenant-Based Rental Assistance Program, and
HOMEbuyer Assistance Program. As of December 2017, over $10 million is available in
the Texas HOME Disaster Relief Program.
15
Additionally, the Texas Interagency Council for the Homeless (TICH) was established in
1995 and coordinates the state’s resources and services to address homelessness. TICH
serves as an advisory committee to TDHCA. Representatives from 11 state agencies sit on
14
Texas Homeless Network. Webpage accessed January 10, 2018. http://www.thn.org/
15
TDHCA. “HOME Disaster Relief Program.” Webpage accessed January 10, 2018.
http://www.tdhca.state.tx.us/home-division/disaster-relief.htm

Page 18 of 61
the council, along with members appointed by the governor, lieutenant governor, and
speaker of the house of representatives.
16
The council’s duties include:
• Survey current resources for services for the homeless in the state;
• Assist in coordinating and providing statewide services for all homeless individuals;
• Increase the flow of information among separate providers and appropriate authorities;
• Provide technical assistance to TDHCA in assessing the need for housing for
individuals with special needs in different localities; and
• Maintain a centralized resource and information center for homeless services.
The Department of State Health Services (DSHS) Projects for Assistance in Transition
from Homelessness (PATH) program provides outreach in the form of (1) screening,
diagnostic assessment, and treatment; (2) habitation and rehabilitation; (3) community
mental health services; (4) outpatient alcohol or drug treatment (for clients with serious
mental illness); (5) staff training and case management; (6) referrals for primary health
services, job training, educational services (including HIV prevention activities), and
relevant housing services; (7) assistance in obtaining income support services including
Social Security Income and representative payee per appropriate regulations; (8) housing
services including planning for housing; (9) technical assistance in applying for housing
assistance; and (10) improving coordination of housing and services and the costs of
matching individuals with appropriate housing and services. The service areas are
Amarillo, Austin, Beaumont, Conroe, Corpus Christi, Dallas, El Paso, Fort Worth,
Galveston, Harlingen, Houston, Laredo, Lubbock, San Antonio, and Waco.
Additionally, the Community Services Block Grant program is administered by TDHCA.
For program years 2015 to 2018, over $120 million has been awarded to eligible entities
across Texas for the delivery of services to very low-income Texas residents. The services
are designed to eliminate poverty and foster self-sufficiency.
17
The GLO has been in communication with the Texas Homeless Network (THN) and the
Ending Community Homelessness Coalition (ECHO) for data tied to the impacts of
Hurricane Harvey on the homeless population in Texas. THN and ECHO informed the
GLO that they are currently engaged in efforts to identify homeless persons impacted by
the hurricane. Data gathering will be completed at the end of January 2018. It will then be
assessed and provided to the GLO so that further determinations can be made on how local
communities can better assist their homeless populations.
No funds from this allocation will be set aside specifically to offset and prevent
homelessness, but the next allocation is expected to be much larger. The GLO plans to
create a more substantial homelessness prevention program from future funds.
16
TDHCA. “Texas Interagency Council for the Homeless” (TICH). Webpage accessed January 10, 2018.
http://www.tdhca.state.tx.us/tich/
17
TDHCA. “Community Services Block Grant (CSBG).” Webpage accessed January 10, 2018.
http://www.tdhca.state.tx.us/community-affairs/csbg/index.htm

Page 19 of 61
3. Social Services: 2-1-1 Texas Program
The Texas Health and Human Services Commission (THHSC) 2-1-1 Texas program helps
Texas citizens connect with state and local health and human services programs service by
phone or internet. THHSC works through 25 Area Information Centers (AICs) across the state.
2-1-1 Texas is a free, anonymous, social service hotline available 24-hours a day, 7 days a
week, 365 days a year. State and local health and human services programs address
housing/shelter, employment, food/nutrition, veterans, crisis/emergency, income/expenses,
legal aid/victims, criminal justice, aging/disability, health/medical, mental health, and child
care/education.
According to information received by the GLO from the Health and Human Services
Commission (HHSC), 2-1-1 staff observed a 37 percent increase in call volume beginning
Thursday, August 24, 2017. Top caller needs included calls from the public requesting general
evacuation information and evacuation transportation and calls from city and county
emergency services. On Friday, August 25, 2017, Texas Information and Referral Network
(TIRN) staff created a new menu option that routed callers with Hurricane Harvey needs to the
first available agent statewide, thus prioritizing those callers.
Between August 25 and October 31, 2017, the 2-1-1 TIRN received approximately 670,000
calls. The call summary below shows the volume of calls received pre-Harvey, during Harvey
(August 25–September 30) and post-Harvey.
The table below shows the approximate number of calls divided into time periods before,
during, and immediately following Hurricane Harvey, as well as post-Hurricane Harvey. In the
period during Hurricane Harvey and directly after, there was a large jump in State of Texas
Emergency Assistance Registry (STEAR) calls. STEAR is a free registry that provides local
emergency planners and emergency responders with additional information about the needs in
their local community. This program allows the public to add their information to the registry
if they feel they will require additional assistance during an emergency or disaster event.
Table 2: 2-1-1 Call Volume
Option 1, 4, 8
(TIRN Agents)
Option 5
(TIRN Agents)
Total
Calls Pre-Hurricane Harvey:
August 1–24, 2017
154,509 N/A 154,509
Calls during Hurricane Harvey:
August 25–September 30, 2017
282,811 170,105 452,916
Calls post-Hurricane Harvey:
October 1–31, 2017
177,800 36,577 214,377
Legend:
• Option 1: Community Resources Information and Referral Calls.
• Option 4: STEAR Registration Calls.
• Option 5: Harvey-Related Disaster Calls.
• Option 8: Mental Health and Substance Abuses Information and Referral Calls.

Page 20 of 61
The types of needs also varied during these time periods. Prior to Hurricane Harvey, the top
two needs TIRN agents addressed were calls about were electric service payment assistance
and rent payment assistance. During and directly following the hurricane, the top two needs
were disaster food stamps and electric payment assistance. Disaster food stamps were available
through Texas Health and Human Services Disaster Supplemental Nutrition Assistance
Program (D-SNAP) to provide short-term food assistance benefits to families recovering from
a disaster.
18
The following chart shows top 10 needs of calls received and the volume of calls for the period
during and directly following Hurricane Harvey.
Top 10 call types from August 23–September 30, 2017
Figure 8: Top 10 call types from August 23–September 30, 2017
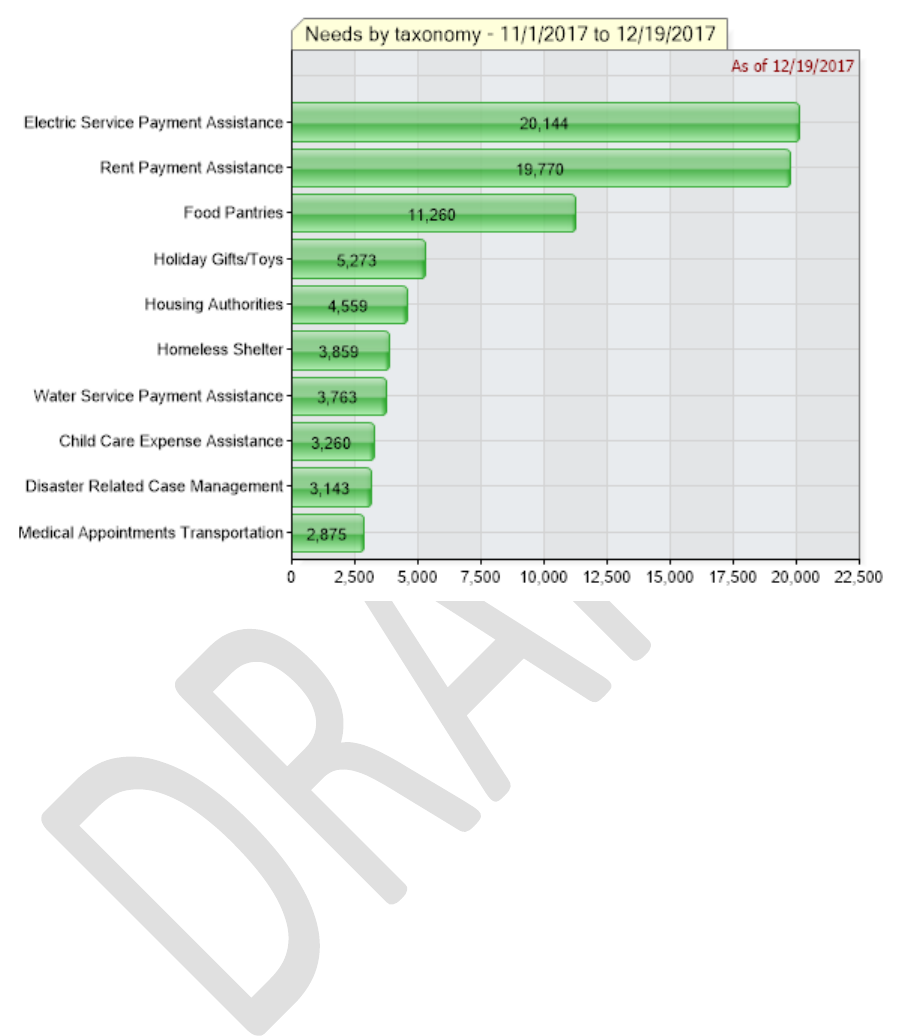
The latest numbers, as of December 19, 2017, show that while calls have decreased somewhat,
TIRN is still experiencing a higher call volume than prior to Hurricane Harvey. Also, the types
of calls show that the call center is still receiving calls related directly to disaster recovery from
Hurricane Harvey, as seen in the following chart.
18
Texas Health and Human Services. “Disaster SNAP.” Webpage accessed January 10, 2018.
https://hhs.texas.gov/services/financial/disaster-assistance/disaster-snap
Page 21 of 61
Figure 9: Top 10 call types from November 1–December 19, 2017
4. Interim Housing Assistance
On September 14, 2017, Governor Greg Abbott designated the GLO as the state lead for short-
term housing recovery programs in partnership with FEMA. These programs are intended to
provide direct housing solutions for permanent repairs and temporary solutions to applicants
deemed eligible by FEMA. The GLO will continue to administer these programs until February
25, 2019. Program descriptions include:
(a) Multi-Family Lease and Repair
This program provides repairs to existing multifamily housing, such as apartments, in order
to provide more housing for eligible applicants. By accepting repairs, property owners must
agree to lease eligible applicants for up to 18 months following the disaster declaration. This
program provides much needed housing for applicants, as well as much needed repairs to
multifamily housing units that may have been impacted during the disaster.

Page 22 of 61
(b) Direct Lease
This program allows the GLO and its subrecipients to enter into leases for properties..
Through the utilization of these properties, the program provides housing for eligible
applicants for up to 18 months following the disaster declaration.
(c) Manufactured Housing Options
This program places manufactured housing units, such as mobile homes and travel trailers,
on private land or commercial pads to temporarily house eligible applicants for up to 18
months following the disaster declaration.
(d) Direct Assistance for Limited Home Repair
This program provides permanent partial repairs to homes with significant damage. Repairs
cannot exceed the lesser of 50 percent of the home’s fair market value or $60,000.
(e) Partial Repair and Essential Power for Sheltering (PREPS)
This program provides temporary repairs of up to $20,000 for homes with less than $17,000
in damage. Temporary repairs may include window units, one functional bathroom, and
small cooking appliances to ensure that the home can serve as a shelter for eligible
homeowners. PREPS requires 10% cost share from the state.
5. National Flood Insurance Program
The National Flood Insurance Program (NFIP) is a FEMA program that works to provide
affordable insurance to property owners in participating communities and works to encourage
communities to adopt and enforce floodplain management regulations. In areas at high risk of
flooding, Congress has mandated that federally regulated or insured lenders require flood
insurance on mortgaged properties.
19
The NFIP offers two types of flood insurance coverage
for homeowners: building property coverage up to $250,000; and personal property coverage
(contents) up to $100,000.
20
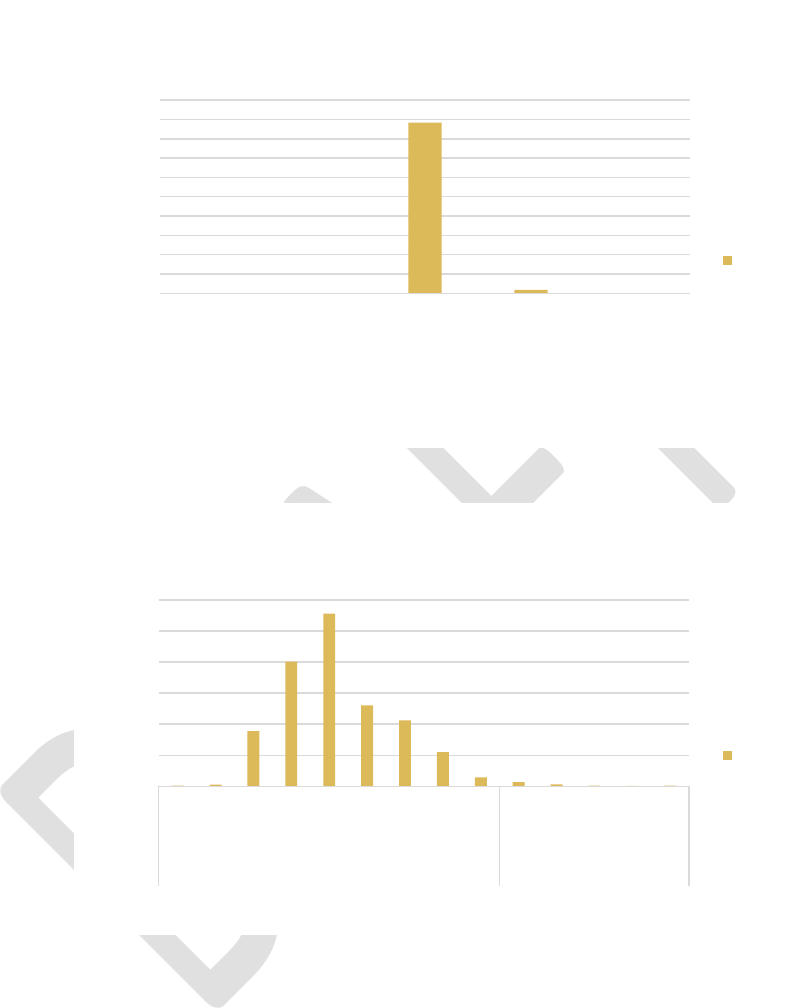
The following information shows the major increase in NFIP claims in the state of Texas as a
direct result of Hurricane Harvey. More than 89,000 claims were filed. With the data broken
down daily during that time, a large jump in claims began on August 25, the day Hurricane
Harvey made landfall.
19
FEMA. “The National Flood Insurance Program.” Webpage accessed January 10, 2018.
https://www.fema.gov/national-flood-insurance-program
20
FEMA. “NFIP Summary of Coverage.” Webpage/PDF accessed January 10, 2018. https://www.fema.gov
/media-library-data /20130726-1620-20490-4648/f_679_summaryofcoverage_11_2012.pdf
Page 23 of 61
Figure 10: NFIP Claims in Texas June to October, 2017
Figure 11: NFIP Claims Filed in Texas By Date of Loss
As the claims are broken down into geographic areas, it is even more evident that the claims
are Hurricane Harvey-related, as the biggest number of claims are coming from areas that are
included in the 49 eligible counties, with the largest number of claims coming from the
Houston area.
128
74
88,286
1,920
62
-
10,000
20,000
30,000
40,000
50,000
60,000
70,000
80,000
90,000
100,000
Jun Jul Aug Sep Oct
NFIP Claims Filed in Texas (June-Oct, 2017)
By Date of Loss
Total
144
281
8,884
20,085
27,812
13,044
10,637
5,549
1,458
704
314
148
100
135
-
5,000
10,000
15,000
20,000
25,000
30,000
23-Aug
24-Aug
25-Aug
26-Aug
27-Aug
28-Aug
29-Aug
30-Aug
31-Aug
1-Sep
2-Sep
3-Sep
4-Sep
5-Sep
Aug Sep
NFIP Claims Filed in Texas (Aug 23-Sept 5, 2017)
By Date of Loss
Total
Page 24 of 61
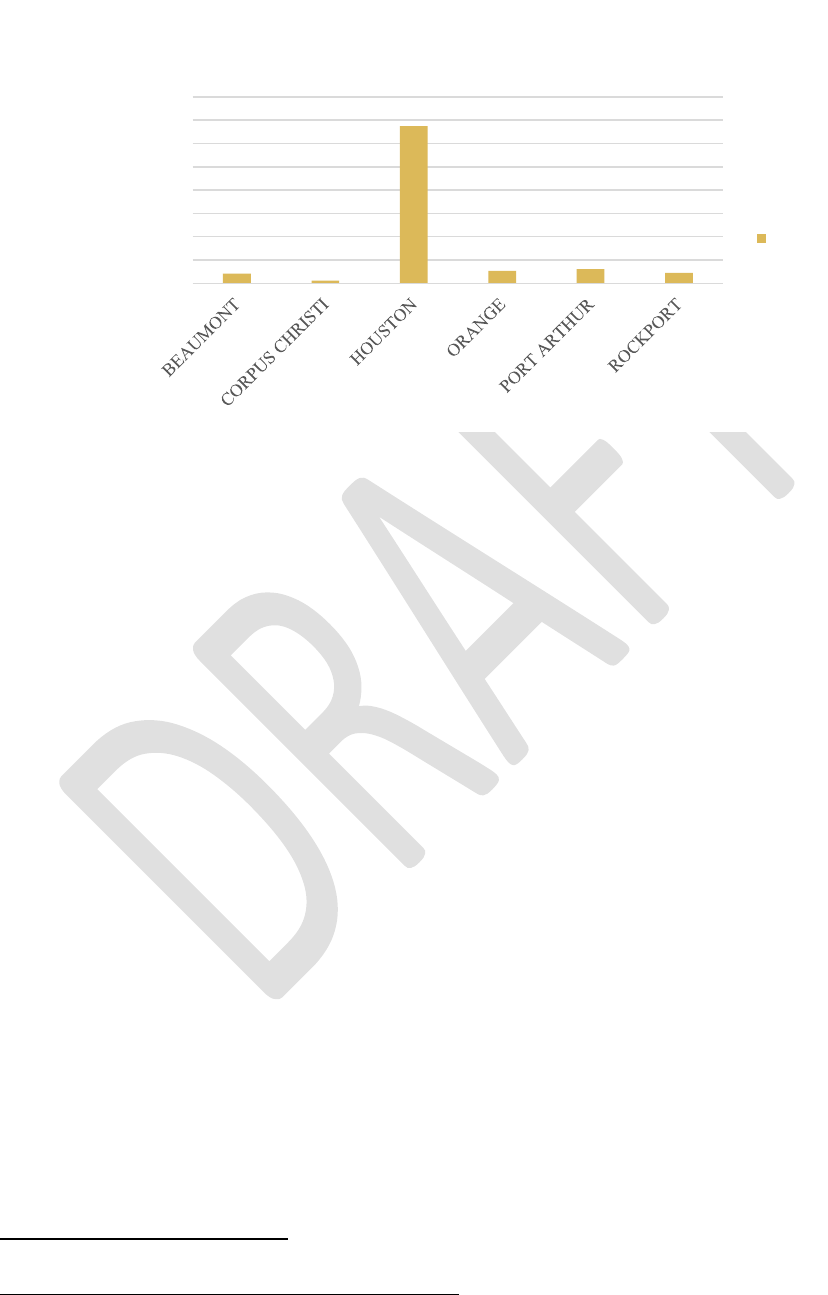
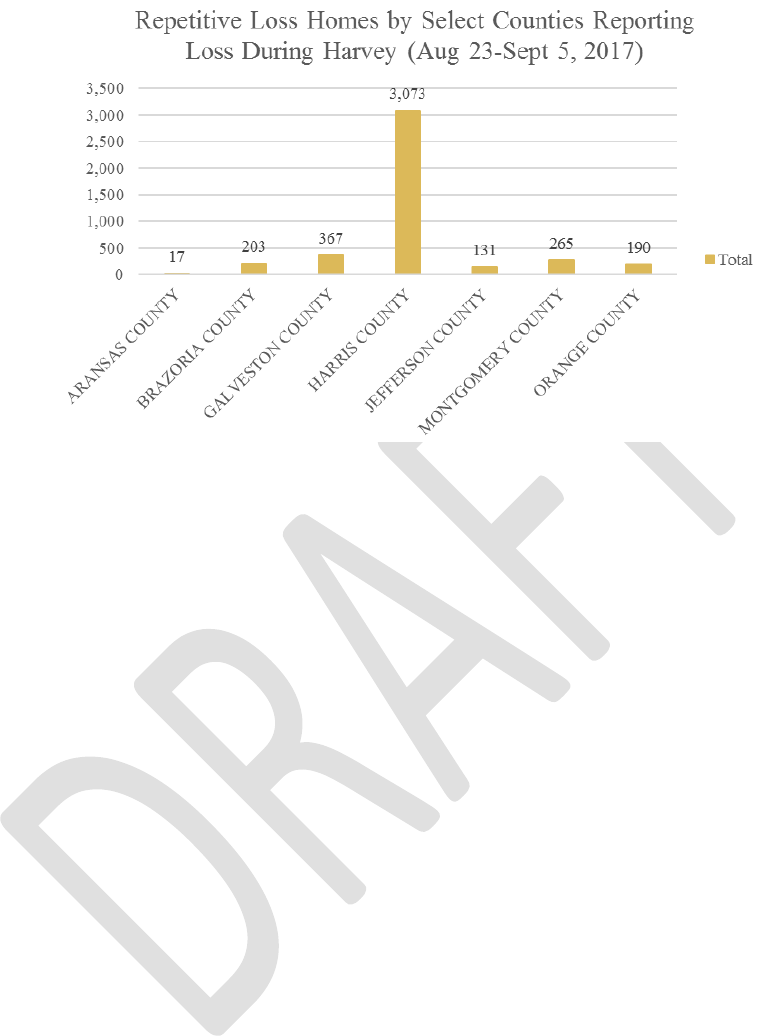
Figure 12: NFIP Claims Filed in 2017 by City
The NFIP data identifies insurance claims that fall into the Repetitive Loss (RL) category. An
RL property is any insurable building for which two or more claims of more than $1,000 were
paid. There are over 120,000 RL properties nationwide, with Texas having more than 27,000.
These RL structures strain the NFIP fund, and currently are the biggest draw on the fund. They
not only increase the NFIP’s annual losses (increasing the need for borrowing), but drain fund
reserves needed to address future catastrophic events.
21
Hurricane Harvey resulted in approximately 4,500 NFIP claims that were designated as
Repetitive Loss. The vast majority of these claims—3,073 or 68 percent—were made in Harris
County. The following graph highlights the counties with the largest numbers of RL properties
that were reported during this period.
21
FEMA. “Repetitive Loss FAQ.” Webpage/Text accessed January 10, 2018.
https://www.fema.gov/txt/rebuild/repetitive_loss_faqs.txt
2,066
578
33,730
2,656
3,078
2,228
-
5,000
10,000
15,000
20,000
25,000
30,000
35,000
40,000
NFIP Claims Filed (2017)
Total
Page 25 of 61
Figure 13: NFIP Repetitive Loss Homes by Select Counties
Additionally, the following map shows the concentration of RL properties with Hurricane
Harvey claims by zip code. While there may be a correlation between zip codes and those RL
properties along rivers such as the Guadalupe River, there is a high concentration of RL
properties located throughout Harris County.

Page 26 of 61
Figure 14: NFIP Repetitive Loss Claims by ZIP Code (August 23 – September 5, 2017)
6. Small Business Assistance (SBA) Disaster Home Loans
Another resource for homeowners that sustained damage from Hurricane Harvey is the Small
Business Administration’s (SBA) disaster loans. These loans are the basic form of federal
disaster assistance for homeowners whose private property sustained damage that is not fully
covered by insurance. Homeowners and renters whose property was damaged by a declared
disaster can apply for an SBA low-interest loan. Interest rates on these loans are determined
by law and are assigned on a case by case basis.
Specific to Hurricane Harvey assistance, interest rates are 1.75 percent if the applicant does
not have credit available elsewhere and 3.5 percent if credit is available elsewhere. The home
loans are limited to $200,000 for the repair or replacement of real estate and $40,000 maximum
to repair or replace personal property.
22
22
U.S. Small Business Administration Fact Sheet. November 7, 2017. “Disaster Loans, Texas Declaration #15274
and #15275.”
Page 27 of 61
As of December 7, 2017, over $2.5 billion in home loans have been approved by the SBA. A
breakdown of the approved loans is categorized by county and Councils of Governments
(COG) in the table below.
Table 3. Total Home Loans Approved by SBA
County
COG
Total Home
Loans
KARNES
AACOG
$ 244,500
Total AACOG
$ 244,500
GRIMES
BVCOG
$ 66,400
Total BVCOG
$ 66,400
BASTROP
CAPCOG
$ 1,037,700
CALDWELL
CAPCOG
$ 482,600
FAYETTE
CAPCOG
$ 3,853,300
LEE
CAPCOG
$ 135,500
Total CAPCOG
$ 5,509,100
ARANSAS
CBCOG
$ 58,387,400
BEE
CBCOG
$ 1,359,200
KLEBERG
CBCOG
$ 117,300
NUECES
CBCOG
$ 50,410,000
REFUGIO
CBCOG
$ 8,184,000
SAN PATRICIO
CBCOG
$ 29,469,000
Total CBCOG
$ 147,926,900
JASPER
DETCOG
$ 3,268,300
NEWTON
DETCOG
$ 5,591,900
POLK
DETCOG
$ 1,509,000
SABINE
DETCOG
$ 16,800
SAN JACINTO
DETCOG
$ 2,385,800
TYLER
DETCOG
$ 1,485,300
Total DETCOG
$ 14,257,100
CALHOUN
GCRPC
$ 8,089,500
DEWITT
GCRPC
$ 1,290,800
GOLIAD
GCRPC
$ 1,769,300
GONZALES
GCRPC
$ 316,400
JACKSON
GCRPC
$ 1,114,400
LAVACA
GCRPC
$ 653,600
VICTORIA
GCRPC
$ 19,325,500
Total GCRPC
$ 32,559,500
AUSTIN
H-GAC
$ 901,800
BRAZORIA
H-GAC
$ 110,839,900
CHAMBERS
H-GAC
$ 46,932,500
COLORADO
H-GAC
$ 857,800
FORT BEND
H-GAC
$ 262,415,100
Page 28 of 61
County
COG
Total Home
Loans
GALVESTON
H-GAC
$ 206,936,400
HARRIS
H-GAC
$ 1,088,729,500
LIBERTY
H-GAC
$ 23,513,800
MATAGORDA
H-GAC
$ 5,435,500
MONTGOMERY
H-GAC
$ 50,882,400
WALKER
H-GAC
$ 765,700
WALLER
H-GAC
$ 4,655,200
WHARTON
H-GAC
$ 15,949,200
Total H-GAC
$ 1,818,814,800
HARDIN
SETRPC
$ 93,195,600
JEFFERSON
SETRPC
$ 223,166,700
ORANGE
SETRPC
$ 230,145,700
Total SETRPC
$ 546,508,000
GRAND
TOTAL
$ 2,565,886,300
7. Public Housing Assistance (PHA) Data
The GLO is currently working with its partners to gather information on the impact of
Hurricane Harvey on public housing. Although the GLO can reasonably assume that there was
a negative impact on this population, complete data is not currently available. Once data
gathering is complete, the information will be assessed and determinations of unmet need,
based on this data, will be included in future iterations of this Action Plan.
8. FEMA Individual Assistance
The Individual Assistance (IA) data received from FEMA on December 7, 2017, was used to
quantify all housing applicants impacted by Hurricane Harvey. This information was then used
to calculate the unmet need by county and COG and divided into renter and owner subsets.
More than 889,000 applications were received according to FEMA. Of that number, FEMA
verified that over 278,000 applicants had a FEMA Verified Loss (FVL) over $0.
The total number of owner-occupied applicants in the eligible counties with over $8,000 in
real property damage is 91,561. The greatest number of these owner-occupied applicants are
in Harris County, with a total over 45,800.
The total number of renter applicants in the eligible counties with over $2,000 in personal
property damage is 36,838. The greatest number of these renter-occupied applicants are, again,
in Harris County, with a total of 22,800.

Page 29 of 61
Using the above thresholds to calculate unmet need, 91,561 (71 percent) of the 128,399
applicants are owner-occupied homes, while 36,838 (29 percent) are renters.
Table 4: Total IA Applications as of December 7, 2017
Occupancy Type
Total Applications
FEMA Verified Loss
(FVL) Over $0
Applicants with
Unmet Need
Owner
442,097
200,618
91,561
Renter
443,198
77,997
36,838
Not Specified
4,089
103
0
Totals
889,384
278,718
128,399
a. Total Unmet Needs
The GLO has compiled information from FEMA for individual assistance in order to
document estimated repair costs and unmet housing needs by eligible county. The
population structure used includes owner-occupied households and renter households. For
the purpose of this analysis, the GLO is utilizing certain components of HUD’s
methodology for unmet need for both types of households.
Owner-occupied Homes
To calculate the level of real property damage for owner-occupied homes, the following
criteria was used:
• Major-Low: $8,000 to $14,999 of FEMA verified loss.
• Major-High: $15,000 to $28,800 of FEMA verified loss.
• Severe: Greater than $28,800 of FEMA verified loss.
Renter-occupied Homes
To calculate the level of personal property damage for renters, the following criteria was
used:
• Major-Low: $2,000 to $3,499 of FEMA verified loss.
• Major-High: $3,500 to $7,499 of FEMA verified loss.
• Severe: Greater than $7,500 of FEMA verified loss.
To calculate estimated unmet need, the GLO used multipliers provided by HUD. These
multipliers are based on the SBA median repair cost for the specific disaster category less
the weighted average of expected SBA and FEMA repair costs. Based on FEMA individual
assistance data provided to the GLO, the estimated weighted average of expected SBA and
FEMA total repair costs for each category is represented in the following table.
Page 30 of 61
Table 5: Unmet Need Multiplier by Damage Category
Category
Multiplier Amount
Major-Low
$58,956
Major-High
$72,961
Severe
$102,046
The following table provides a breakdown of total unmet needs for owner- and renter-
occupied households. It provides the repair cost category and the total count and unmet
need for those three categories as previously defined.
Table 6: Category of Unmet Needs by Owner-Occupied and Renters
Damage
Category/
Multiplier
Total
Count
Total Owner-
Occupied and
Rental Unmet
Needs
Owner-
Occupied
Count
Total Owner
Occupied
Unmet Needs
Rental
Count
Total Rental
Unmet Needs
Major-Low:
$58,956
45,363 $2,674,421,028 32,512 $1,916,777,472 12,851 $757,643,556
Major-High:
$72,961
61,267 $4,470,101,587 41,887 $3,056,117,407 19,380 $1,413,984,180
Severe:
$102,046
21,769 $2,221,439,374 17,162 $1,751,313,452 4,607 $470,125,922
Total
128,399
$9,365,961,989
91,561
$6,724,208,331
36,838
$2,641,753,658
As defined by the table, the owner-occupied unmet need in dollars is $6.7 billion (72
percent) and the renter unmet need is $2.6 billion (28 percent), resulting in a total unmet
need of $9.3 billion.
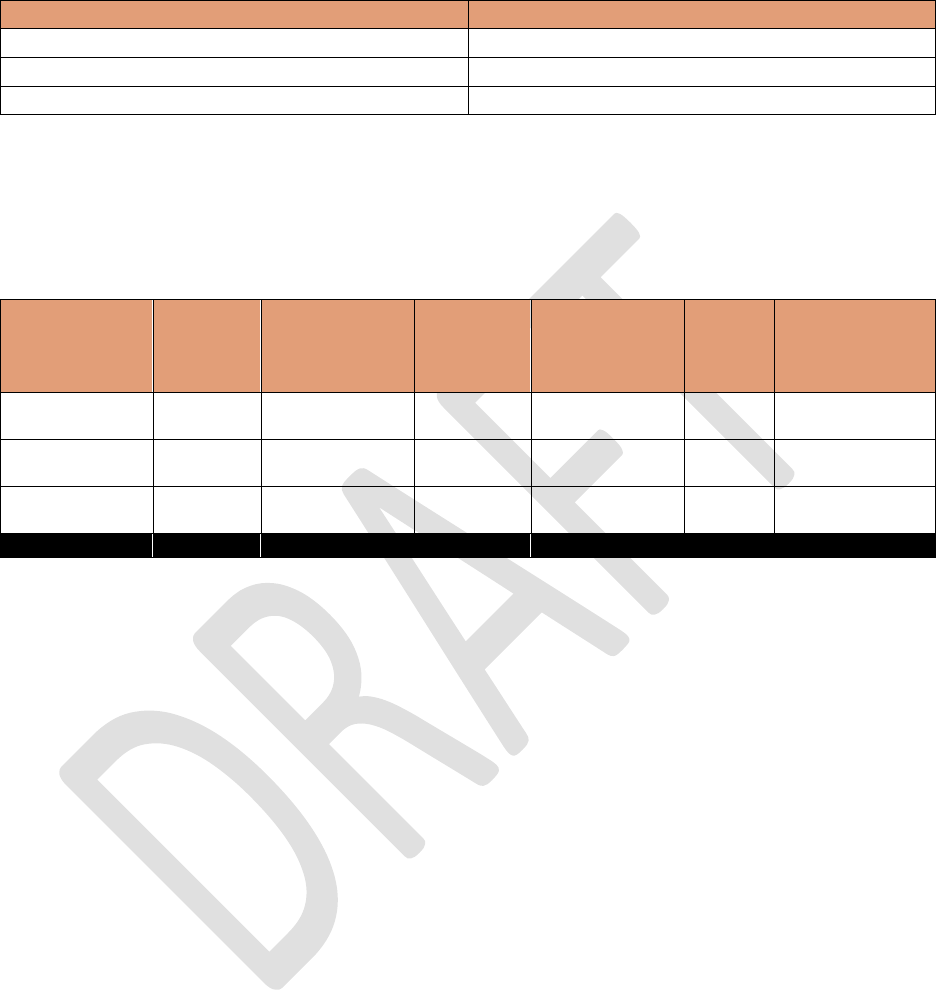
A breakdown of total unmet need by total cost per county is represented in the following
map. Harris County shows the highest estimated unmet need, with an estimated total count
of major-low damage or greater count of more than 68,000, with an estimated countywide
total unmet need of over $4.9 billion.
Page 31 of 61
Figure 15: Total Count of Unmet Need by County (as of December 7, 2017).
HUD requirements for this CDBG-DR allocation specify that the GLO must expend a
minimum of 70 percent to benefit LMI populations. The GLO used self-reported applicant
information provided by FEMA to calculate what percentage of the population in the
eligible counties falls into certain income categories. Approximately 45 percent of the
unmet need is below 80 percent in the LMI category. The unmet need for the LMI
population is over $4.28 billion dollars. The unmet need by income category for all eligible
counties can be seen in the following table.
Page 32 of 61
Table 7: Unmet Need by Income Category/Owner-Occupied and Renter
Income Category Count Unmet Need
% of
Count
% of
Unmet
Need
0-30%
26,819
$1,913,842,869
21%
20%
31-50%
13,443
$955,895,868
10%
10%
51-80%
19,689
$1,417,781,539
15%
15%
Not LMI
52,436
$3,898,284,351
41%
42%
Not Reported
16,012
$1,180,157,362
12%
13%
Total
128,399
$9,365,961,989
100%
100%
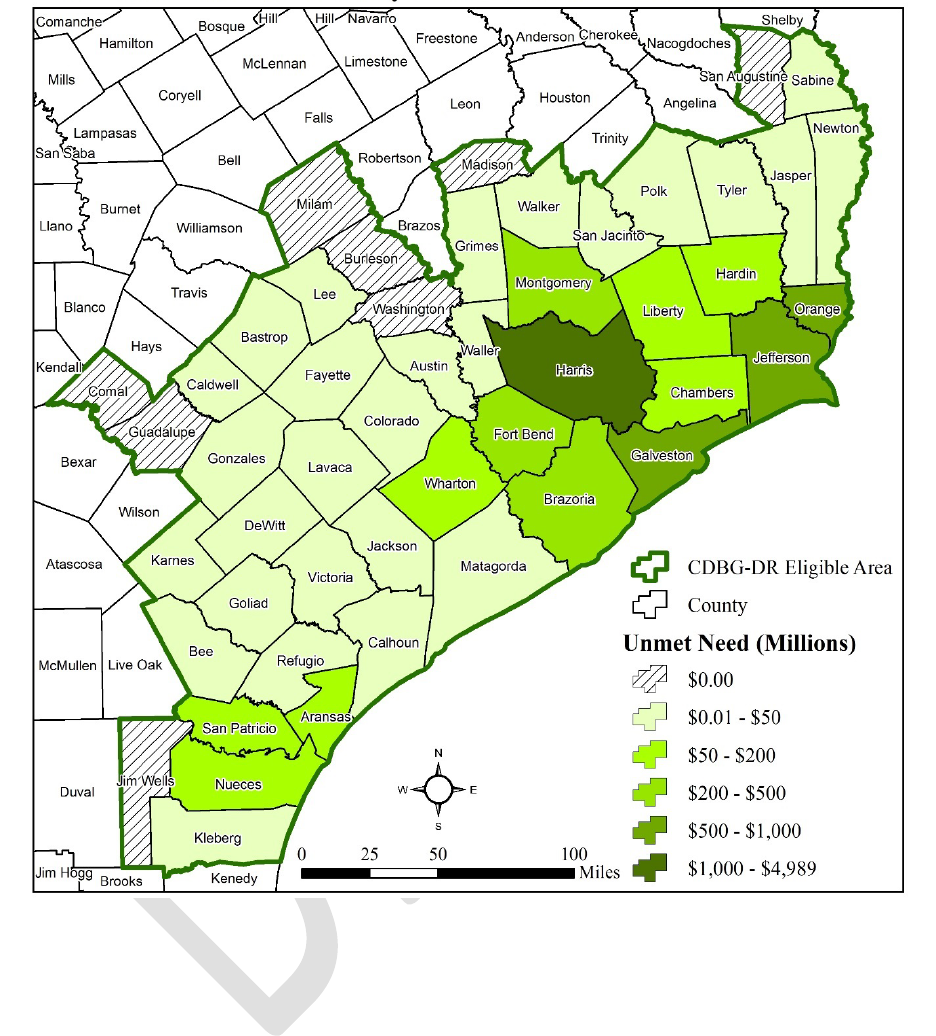
b. Owner-occupied Unmet Need
A breakdown of unmet need by total cost per county for owner-occupied homes is
represented in the following map. Harris County had an applicant count of 45,802
totaling over $3 billion.
Figure 16: Owner-occupied Unmet Need by County

Page 33 of 61
Approximately 38 percent of the owner-occupied unmet need is below 80 percent LMI
category. The unmet need by income category for owner-occupied households for all
eligible counties can be seen in the following table.
Table 8. Owner Unmet Need by Income Category
Income Category Count Unmet Need % of Count
% of Unmet
Need
0-30%
13,105
$929,680,285
14%
14%
31-50%
8,227
$584,904,417
9%
9%
51-80%
13,625
$979,819,790
15%
15%
Not LMI
45,171
$3,374,105,811
49%
50%
Not Reported
11,433
$855,698,028
12%
13%
Total
91,561
$6,724,208,331
100%
100%
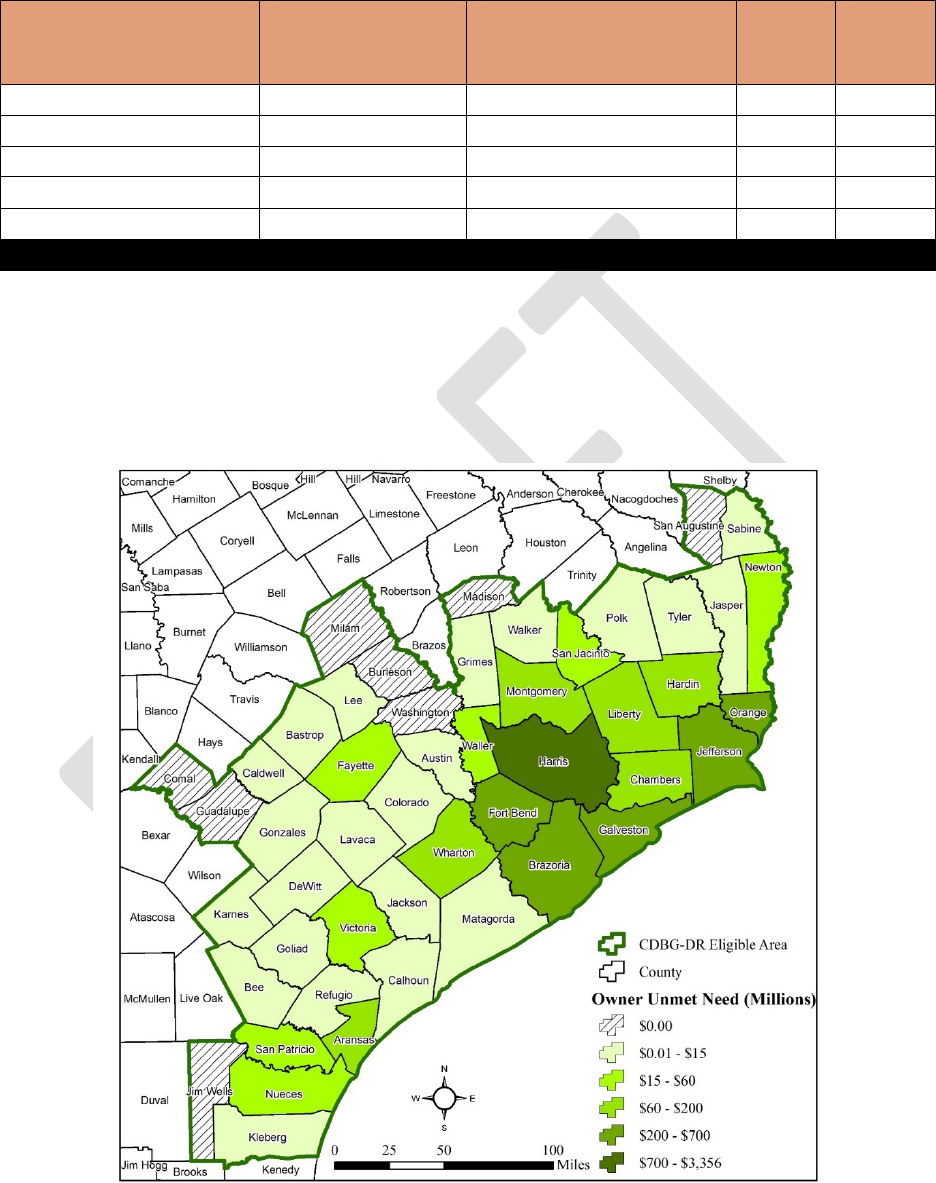
c. Renter-occupied Unmet Need
Harris County had the highest amount of unmet need again with approximately 22,800
renter applications with a total estimated unmet need of over $1.6 billion. A breakdown
of unmet need per county by total cost for rental applicants is represented in the following
map.
Page 34 of 61
Figure 17: Renter Unmet Need by County
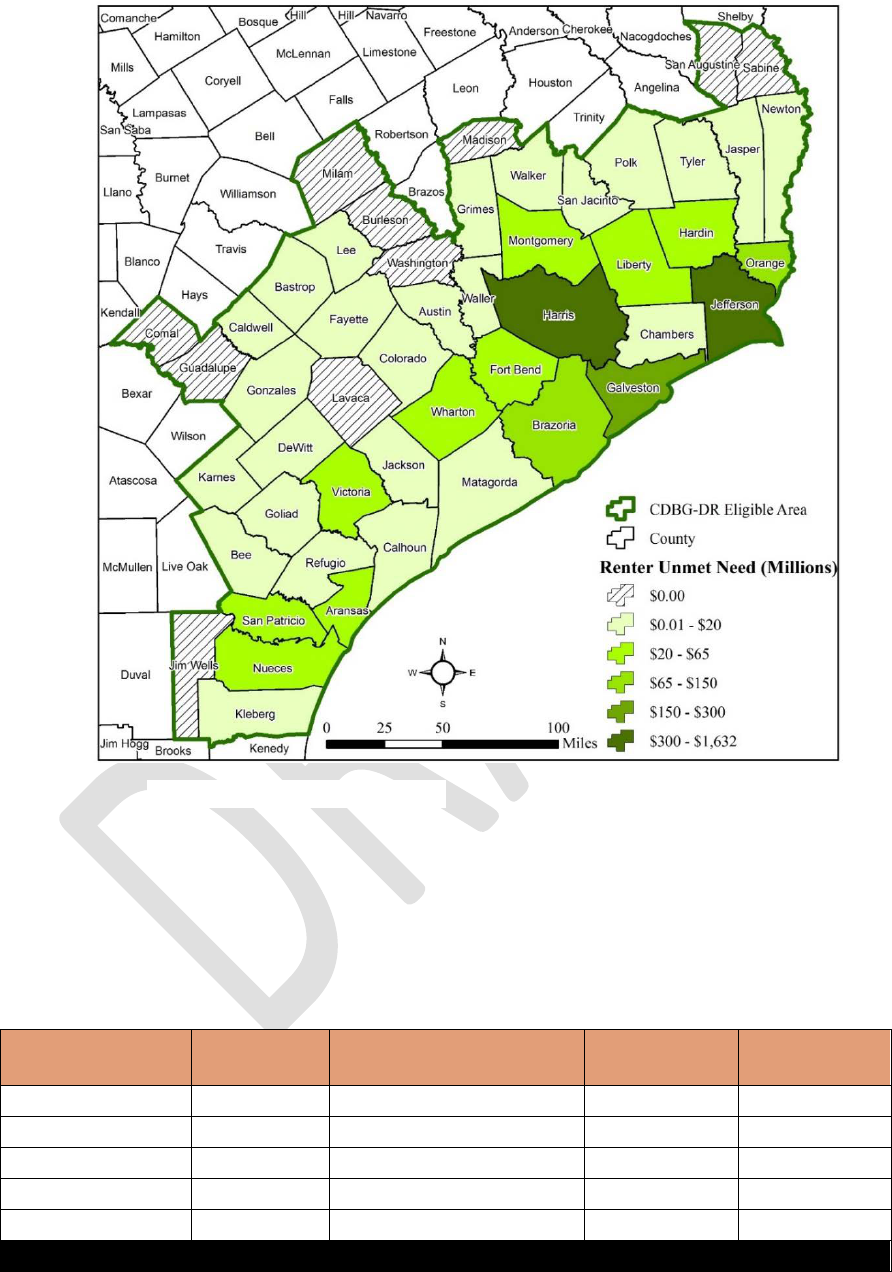
The GLO calculated the percentage of population of renter households within LMI
categories. Approximately 68 percent of the unmet need is below 80 percent LMI
category. The unmet need by income category for renters in all eligible counties can be
seen in the following table.
Table 9. Renter Unmet Need by Income Category
Income
Category
Count
Unmet Need
% of Count
% of Unmet
Need
0-30%
13,714
$984,162,584
37%
37%
31-50%
5,216
$370,991,451
14%
14%
51-80%
6,064
$437,961,749
17%
17%
Not LMI
7,265
$524,178,540
20%
20%
Not Reported
4,579
$324,459,334
12%
12%
Total
36,838
$2,641,753,658
100%
100%

Page 35 of 61
G. Infrastructure Impact
Texas infrastructure all along the Gulf Coast was affected by Hurricane Harvey. This event
caused damage to roadways, bridges, sections of the coastline, and many other infrastructure
systems still being determined.
1. Governor’s Commission to Rebuild Texas
Governor Greg Abbott established the Governor’s Commission to Rebuild Texas (the
Commission) in the immediate aftermath of Hurricane Harvey for the swift and effective
restoration of damaged public infrastructure
throughout disaster impacted areas. As
stated in the Governor’s Proclamation on
September 7, 2017, for the establishment of
the Commission, the effective restoration of
damaged public infrastructure throughout
the disaster area is of paramount importance
to the Texas economy and to the people of
Texas who live and work in the communities
affected by Hurricane Harvey. The
Commission will assist local governmental
entities and nonprofit organizations to assess
and identify rebuilding needs and to
navigate state and federal resources
available for the rebuilding effort. The
Commission will advocate for the interests
of state and local governments on matters
related to disaster response and provide
expertise and assistance to local
governmental entities and nonprofit organizations throughout the rebuilding process.
23
The “October 31, 2017, Request for Federal Assistance Critical Infrastructure Projects"
reported $61 billion in projects identified at state and local levels. This amount does not include
current FEMA expenditures or CDBG-DR housing allocations. The $61 billion was compiled
based on information available in September and October from impacted communities that
identified and prioritized their needs. This amount is expected to increase as more information
becomes available.
The types of identified projects include restoration and mitigation projects for roads, bridges,
schools, government buildings, public facilities, as well as projects to protect coastal
23
RebuildTexas: The Governor’s Commission to Rebuild Texas. “Proclamation.” Webpage assessed January 10,
2018. https://www.rebuildtexas.today/proclamation/
Source: HOU District Twitter feed – Aug 28, 2017
(https://twitter.com/TxDOTHoustonPIO)
Page 36 of 61
infrastructure, homes, businesses, critical facilities, and national assets such as petrochemical
complexes. Over 60 percent of the projects identified were for flood control projects.
24
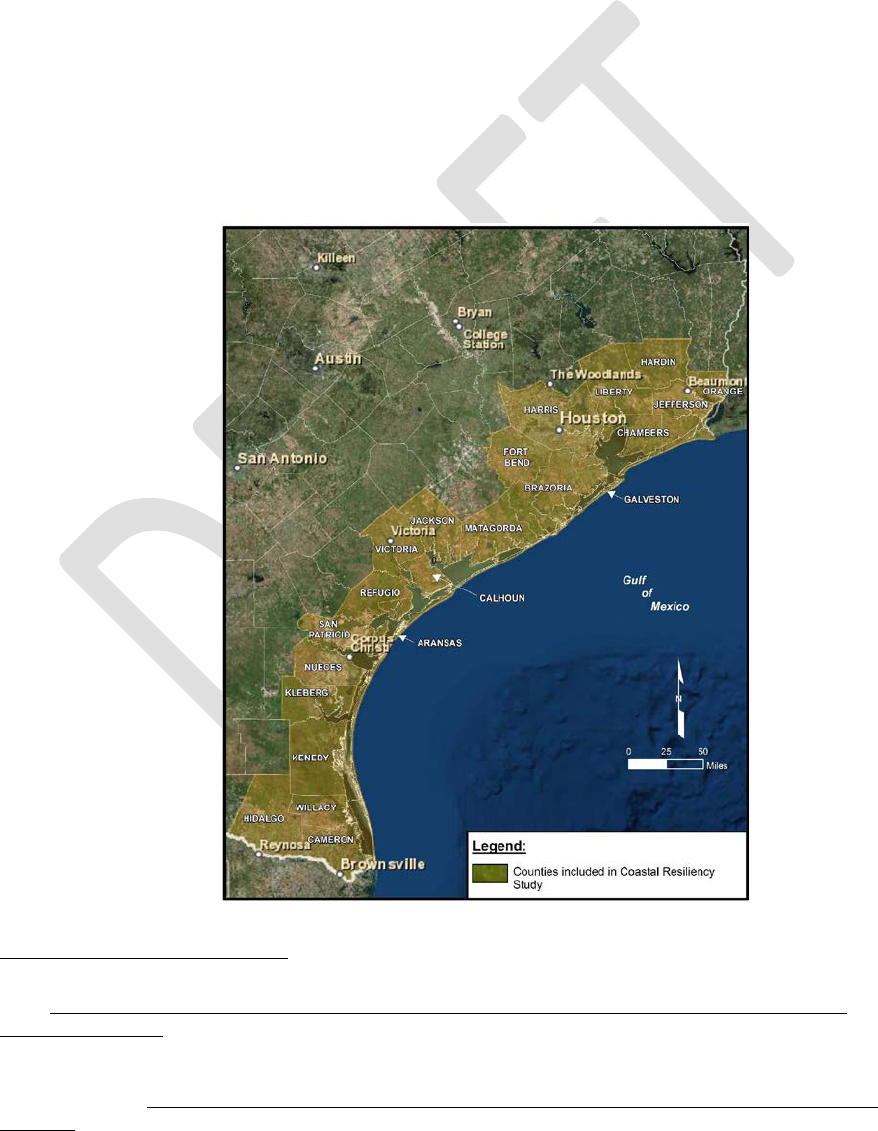
2. Texas Coastal Resiliency Study
With previous CDBG-DR funds, the GLO commissioned a Texas Coastal Resiliency Study to
identify critical infrastructure within a coastal multi-county project study area that would be
most vulnerable to future storm events. During this study, sites considered to be at risk were
identified and new projects were proposed to mitigate potential damage to vulnerable
infrastructure. As expected, many of these sites were impacted by Hurricane Harvey, but to
what degree is still being determined. The improvements identified in this study should provide
practical solutions that communities can quickly utilize for repairs and mitigation. This study
identified 2,256 projects in the coastal region.
25
Figure 18: Texas Coastal Resiliency Study Area
24
Ibid. “Request for Federal Assistance Critical Infrastructure Projects.” Webpage/PDF accessed January 10,
2018. https://www.documentcloud.org/documents/4164748-Rebuild-Texas-REQUEST-FOR-FEDERAL-
ASSISTANCE.html
25
The Texas General Land Office. “Texas Coastal Resiliency Study, Final Report.” Webpage/PDF accessed
January 10, 2018. http://www.glo.texas.gov/coastal-grants/_documents/grant-project/texas-coastal
-resiliency-
study.pdf

Page 37 of 61
3. FEMA Public Assistance
Due to the vast size of the impact area and different types of recovery that will be necessary,
Public Assistance is not the ideal data set to determine infrastructure need but it does serve as
a statewide metric to begin the discussion. Public Assistance values are very preliminary, with
mostly emergency protective measures being calculated to date. Estimates for permanent work
will continue to be forthcoming over the next several months. For this Action Plan, given the
limited amount available in this first allocation and the availability of data, housing unmet
needs have been prioritized.
Due to the 90 percent federal cost share tied to the approximate cost amount, the total PA
infrastructure unmet need for these localities will be calculated from the remaining 10 percent
of the projected cost amount plus 15 percent of the approximate cost as a resiliency multiplier.
Though impossible to determine at this time, future property valuations and the overall impact
of Hurricane Harvey on property values should be taken into consideration for the long‐term
struggle that communities will face as they continue to recover using their own resources.
While unmet housing needs will be addressed, there still remains significant unmet need in
infrastructure and other non‐housing sectors, including future tax revenue loss due to Hurricane
Harvey. Projects affiliated with economic revitalization or infrastructure activities will
contribute to the long‐term recovery and restoration of housing in the most impacted and
distressed areas as well as ensure the ongoing viability of the impacted areas and beyond.

Page 38 of 61
H. Economic Impact
1. Employment
a. Statewide Statistics
As of August 2017, jobs had grown in the state from 12,035,300 to 12,328,400, according to
figures published by the Texas Workforce Commission. That is a 2.4 percent year-over-year
increase from August of 2016, a net increase of 293,100 new jobs. In addition, the statewide
unemployment rate for August decreased to 4.5 percent from 4.9 percent in 2016. In a growing
economy like Texas, long-term job growth and unemployment increases were impacted by
Hurricane Harvey, but to what extent is impossible to determine at this time. The October 2017
figures show an unemployment rate of 3.5 percent and an increase in employment numbers
from 12,328,400 in August to 12,922,084 in October 2017.
b. County Level
Of the 49 eligible counties, almost all follow the statewide trend. There are, however, two
counties that have higher unemployment rates following Hurricane Harvey according to the
statistics provided on the Texas Workforce Commission website. The unemployment rate in
Aransas County went up from 5.5 percent in August 2017 to 8 percent in October 2017, and
Refugio County’s unemployment rate increased from 5.7 percent to 6.2 percent. Although the
unemployment rates increased, the employment numbers in both counties slightly increased.
Aransas County increased from 9,568 to 9,645 (0.8 percent) and Refugio County increased
from 2,809 to 2,837 (0.9 percent).
c. Disaster Unemployment Assistance
The Disaster Unemployment Assistance program, administered by FEMA and the Texas
Workforce Commission, provides unemployment benefits for individuals who lost their jobs
or are no longer working as a direct result of Hurricane Harvey. The application deadline for
applications was November 13, 2017. Through this program, a total of 24,758 claims were
received, and 12,997 people were approved for assistance totaling $11,201,909.
2. Small Business Assistance (SBA) Business Disaster Loans
The SBA provides Business Physical Disaster Loans and Economic Injury Disaster Loans
(EIDL) to businesses to repair or replace disaster-damaged property owned by the business,
including real estate, inventories, supplies, machinery, equipment, and working capital until
normal operations resume. Businesses of all sizes are eligible. Private, non-profit organizations
such as charities, churches, and private universities are also eligible. The law limits these
business loans to $2,000,000, and the amount cannot exceed the verified uninsured disaster
loss.
26
26
U.S. Small Business Administration Fact Sheet. November 7, 2017. “Disaster Loans, Texas Declaration #15274
and #15275.”

Page 39 of 61
The SBA has already approved over $579 million in business loans as of December 7, 2017.
The breakdown by county and COG can be seen in the following table.
Table 10: Total Business Loans Approved by the SBA
County
COG
Business/EIDL
Loans
BURLESON
BVCOG
$ 50,000
Total BVCOG
$ 50,000
BASTROP
CAPCOG
$ 40,000
FAYETTE
CAPCOG
$ 547,900
Total CAPCOG
$ 587,900
ARANSAS
CBCOG
$ 58,461,900
BEE
CBCOG
$ 4,801,000
KLEBERG
CBCOG
$ 43,300
NUECES
CBCOG
$ 20,309,300
REFUGIO
CBCOG
$ 1,710,900
SAN PATRICIO
CBCOG
$ 14,822,900
Total CBCOG
$ 100,149,300
NEWTON
DETCOG
$ 50,000
POLK
DETCOG
$ 631,600
SAN JACINTO
DETCOG
$ 266,400
Total DETCOG
$ 948,000
CALHOUN
GCRPC
$ 2,806,400
GOLIAD
GCRPC
$ 99,100
GONZALES
GCRPC
$ 75,000
JACKSON
GCRPC
$ 2,506,100
LAVACA
GCRPC
$ 18,800
VICTORIA
GCRPC
$ 13,550,100
Total GCRPC
$ 19,055,500
AUSTIN
H-GAC
$ 248,900
BRAZORIA
H-GAC
$ 7,625,900
CHAMBERS
H-GAC
$ 13,355,600
COLORADO
H-GAC
$ 1,183,600
FORT BEND
H-GAC
$ 22,460,200
GALVESTON
H-GAC
$ 32,364,700
HARRIS
H-GAC
$ 288,656,700
LIBERTY
H-GAC
$ 3,049,600
MATAGORDA
H-GAC
$ 1,530,100
MONTGOMERY
H-GAC
$ 10,625,200
WALKER
H-GAC
$ 120,600
WALLER
H-GAC
$ 428,100
WHARTON
H-GAC
$ 3,205,600
Total H-GAC
$ 384,854,800
Page 40 of 61
County
COG
Business/EIDL
Loans
HARDIN
SETRPC
$ 7,975,300
JEFFERSON
SETRPC
$ 31,350,100
ORANGE
SETRPC
$ 34,368,900
Total SETRPC
$ 73,694,300
GRAND TOTAL
$ 579,389,800
The following table provides details from SBA as of January 1, 2018, on the application status
for the 11,701 business applications that have been received. The application period for
physical damages was scheduled to close on November 30, 2017, but SBA is accepting
applications postmarked (or submitted electronically) within 60 days of the November 30
deadline without a justification requirement of the applicant. The deadline for small businesses
and most nonprofits to apply for economic injury (working capital) is May 25, 2018.
Table 11: SBA Applicant Breakdown
Application Type
Amount
Percent
Total Business Applications
11,701
100.00%
Processed Applications
10,502
89.75%
In-Process Applications
1,199
10.25%
Declined Applications
5,030
47.90%
Withdrawn Applications
2,670
25.42%
Approved Applications
2,802
26.68%
3. Agricultural Impacts
Texas has a varied
agricultural industry across
the state. Agriculture
provides jobs, food
sources, trade, and port
facilities used in the
distribution of goods. This
industry experienced
serious loss from the rains
and winds of Hurricane
Harvey.
As of November 1, 2017,
Hurricane Harvey caused
more than $200 million in
crop and livestock losses,
according to Texas A&M
AgriLife Extension
Source: AgriLife Extension Twitter Feed; https://twitter.com/txextension

Page 41 of 61
Service economists.
27
Estimated losses by commodity include $93 million in livestock loss;
$100 million loss in cotton crops; and $8 million in loss to the rice and soybean industry. While
the livestock numbers do include industry infrastructure such as fencing that must be repaired
or replaced and approximately 200,000 bales of hay lost,
28
it does not include an estimated
number of dead livestock. These numbers are estimated to be in the tens of thousands. The
reports also do not include losses to the fishing industry, including decreased fishing activity
and storm-related damage to vessels and equipment. This estimate will not be available until
after oyster season ends in late spring 2018.
29
These forthcoming numbers will cause the losses
in the agriculture industry to continue to increase.
4. Tourism
The Texas coast has many communities that rely on employment and income from tourism.
According to the governor’s 2017 report, The Economic Impact of Travel in Texas, the total
for direct travel spending in the state was $69.1 billion in 2016.
Among the impacted counties along the coast are some of the long-established and most-visited
tourist destinations. 11.6 percent of the employment in Aransas County and 6.7 percent in
Galveston County is directly connected to travel and tourism.
30
Retail, hospitality, and
entertainment are venues that contribute to the local community as well as overall state
employment and business tax revenue. In 2016, the Gulf Coast region of Texas provided jobs
to over 3.4 million people.
31
Although current figures are not available at this time, it is expected that the tourism industry
will lose revenue as a direct result of Hurricane Harvey. Due to the timing of Hurricane Harvey,
areas that rely on tourism have already seen a decline in revenue over Labor Day 2017. It is
expected that the areas will also see losses during Spring Break 2018 and Summer 2018 due
to the ongoing recovery process. The impacts will continue to be seen until tourists choose to
return to the Texas coast they once frequented. The impact could be prolonged if tourists have
a misconception of the actual amount of damage. Even areas with little to no disaster damage
will likely see a decline in tourism based on public perception.
27
Texas A&M Agrilife Extension. “Texas agricultural losses from Hurricane Harvey estimated at more than $200
million.” Webpage accessed January 10, 2018. https://today.agrilife.org/2017/10/27/texas-agricultural-losses-
hurricane-harvey-estimated-200-million/
28
Texas Farm Bureau. “Hurricane Harvey ag losses top $200 million.” Webpage accessed January 10, 2018.
http://texasfarmbureau.org/hurricane-harvey-ag-losses-top-200-million/
29
The Texas Observer. “New Estimate Puts Harvey Agriculture Losses at $200 Million, One-Tenth of Irma.”
Webpage accessed January 10, 2018.
https://www.texasobserver.org/agriculture-losses-estimated
-200-million-harvey/
30
Texas Tourism, Office of the Governor, Texas Economic Development & Tourism. The Economic Impact of
Travel in Texas.” July 2017. Webpage/PDF accessed January 10, 2018. https://travel.texas.gov/tti/media/PDFs
/TXImp16p_1.pdf
31
Ibid.

Page 42 of 61
III. General Requirements
A. Public Housing, Affordable Housing, and Housing for Vulnerable Populations
The GLO will identify and address the rehabilitation, reconstruction, and replacement of the
following types of housing affected by the disasters: public housing (including administrative
offices), HUD-assisted housing, affordable housing, McKinney-Vento Homeless Assistance Act-
funded shelters and housing for the homeless, including emergency shelters and transitional and
permanent housing for the homeless; and private market units receiving project-based assistance,
or with tenants that participate in the Section 8 Housing Choice Voucher Program.
Various target populations are eligible to be served, including homeless and special needs
populations. CDBG-DR funds received by the state will be used in the recovery efforts from
Hurricane Harvey for specific disaster-related purposes. Due to the limited amount of funds for
this allocation, the GLO is not setting aside funds for these target populations. The GLO will re-
evaluate setting aside funds for these target populations with subsequent Hurricane Harvey CDBG-
DR fund allocations.
All proposed projects will undergo Affirmatively Furthering Fair Housing (AFFH) review by the
GLO before approval. Such review will include assessments of (1) a proposed project’s area
demography, (2) socioeconomic characteristics, (3) housing configuration and needs, (4)
educational, transportation, and health care opportunities, (5) environmental hazards or concerns,
and (6) all other factors material to the AFFH determination. Applications should show that
projects are likely to lessen area racial, ethnic, and low-income concentrations, and/or promote
affordable housing in low-poverty, nonminority areas in response to natural hazard-related
impacts. All subrecipients will certify that they will satisfy the AFFH rule in their grant agreements
and will receive GLO training and technical assistance in meeting their AFFH obligations.
B. Displacement of Persons and/or Entities
To minimize the displacement of persons and/or entities that may be affected by the activities
outlined in this Action Plan, the GLO will coordinate with other state agencies, local governments,
and local non-profit organizations to ensure minimal displacement. However, should any proposed
projects cause the displacement of people, the GLO will ensure that subrecipients follow the
requirements set forth under the Uniform Relocation Assistance and Real Property Acquisition
Policies Act, as waived.
The relocation assistance requirements at section 104(d)(2)(A) of the Housing and Community
Development Act and 24 CFR 42.350 are waived to the extent that they differ from the
requirements of the URA and implementing regulations at 49 CFR part 24, as modified by the
notice, for activities related to disaster recovery. Without this waiver, disparities exist in relocation
assistance associated with activities typically funded by HUD and FEMA (e.g., buyouts and
relocation). Both FEMA and CDBG funds are subject to the requirements of the URA; however,
CDBG funds are subject to Section 104(d), while FEMA funds are not. The URA provides that a
displaced person is eligible to receive a rental assistance payment that covers a period of 42
months. By contrast, Section 104(d) allows a lower-income displaced person to choose between

Page 43 of 61
the URA rental assistance payment and a rental assistance payment calculated over a period of 60
months. This waiver of the Section 104(d) requirements assures uniform and equitable treatment
by setting the URA and its implementing regulations as the sole standard for relocation assistance
under the federal register notice.
C. Maximum Assistance
The maximum amount of assistance available to subrecipients under the GLO’s disaster recovery
program will be the maximum allocated to the HUD most impacted and distressed areas. For all
housing and buyout programs, the GLO’s housing guidelines establish housing assistance
maximums. Each subrecipient will set the maximum amount of assistance available to a
beneficiary under its program to be equal to or less than the GLO’s housing assistance maximums.
A waiver request must be submitted to the GLO if a subrecipient’s housing assistance maximums
exceed the GLO amounts. The GLO will evaluate each housing assistance waiver request for cost
effectiveness.
D. Elevation Standards
The GLO will apply the following elevation standards to new construction, repair of substantial
damage, or substantial improvement of structures located in an area delineated as a flood hazard
area or equivalent in FEMA’s data source identified in 24 CFR 55.2(b)(1). All structures, as
defined under 44 CFR 59.1, designed principally for residential use and located in the annual (or
100-year) floodplain that receive assistance for new construction, repair of substantial damage, or
substantial improvement, as defined under 24 CFR 55.2(b) (10), must be elevated with the lowest
floor, including the basement, at least 2 feet above the annual floodplain elevation. Residential
structures with no dwelling units and no residents below the annual floodplain must be elevated or
floodproofed in accordance with FEMA floodproofing standards under 44 CFR 60.3(c)(3)(ii) or
successor standard, up to at least 2 feet above the annual floodplain. Applicable state, local, and
tribal codes and standards for floodplain management that exceed these requirements, including
elevation, setbacks, and cumulative substantial damage requirements, will be followed.
E. Planning and Coordination
The GLO’s recovery projects will be developed in a manner that considers an integrated approach
to address long-term recovery and restoration of infrastructure, housing, and economic
revitalization in the most impacted and distressed areas.
The GLO will continue to work with state and local jurisdictions to provide guidance on promoting
a sound short- and long-term recovery plans in the affected areas by coordinating available
resources to help in the restoration and recovery of damaged communities. Disaster recovery
presents affected communities with unique opportunities to examine a wide range of issues such
as housing quality and availability, road and rail networks, environmental issues, and the adequacy
of existing infrastructure. The GLO will support long-term plans put in place by local and regional
communities that promote sound, sustainable, long-term recovery planning informed by a post-
disaster evaluation of hazard risk, especially land-use decisions that reflect responsible floodplain
management and take into account continued sea level rise, if applicable. This information should

Page 44 of 61
be based on the history of FEMA flood mitigation efforts and take into account projected increases
in sea level (if applicable), as well as frequency and intensity of precipitation events that are not
considered in current FEMA maps and National Flood Insurance Program premiums.
The GLO will coordinate as much as possible with local and regional planning efforts to ensure
consistency, to promote community-level and/or regional (e.g., multiple local jurisdictions) post-
disaster recovery and mitigation, and to leverage those efforts.
Due to the limited amount of funds for this allocation, the GLO is not setting aside funds for
planning. The GLO anticipates setting aside funds for planning with subsequent Hurricane Harvey
CDBG-DR fund allocations.
F. Infrastructure Activities
The GLO will encourage subrecipients to integrate mitigation measures into rebuilding activities
and the extent to which infrastructure activities funded through this grant will achieve objectives
outlined in regionally or locally established plans and policies that are designed to reduce future
risk to the jurisdiction.
The GLO will encourage subrecipients to consider the costs and benefits of the project when
selecting CDBG-DR eligible projects.
The GLO will seek to ensure that infrastructure activities will avoid disproportionate impact on
vulnerable communities and will create, to the extent practicable, opportunities to address
economic inequities facing local communities. All project applications will undergo an AFFH
review by the GLO before approval. AFFH application reviews will include assessments of a
proposed project’s (1) area demography, (2) socioeconomic characteristics, (3) housing
configuration and needs, (4) educational, transportation, and health care opportunities, (5)
environmental hazards or concerns, and (6) all other factors material to the AFFH determination.
Applications should show that projects are likely to lessen area racial, ethnic, and low-income
concentrations and/or promote affordable housing in low-poverty, nonminority areas in response
to natural hazard-related impacts. All subrecipients will certify that they will satisfy the AFFH rule
in their grant agreements and will receive GLO training and technical assistance in meeting their
AFFH obligations.
The GLO will coordinate with federal, state, local, private, and nonprofit sources to assistant
subrecipients to align investments with other planned state or local capital improvements and
infrastructure development efforts. The GLO will also work with subrecipients to foster the
potential for additional infrastructure funding from multiple sources, including existing state and
local capital improvement projects in planning and the potential for private investment.
The GLO will rely on professional engineers procured by subrecipients to employ adaptable and
reliable technologies to guard against premature obsolescence of infrastructure.

Page 45 of 61
G. Leveraging Funds
The GLO will encourage subrecipients to leverage CDBG-DR funds with funding provided by
other federal, state, local, private, and nonprofit sources to utilize the limited CDBG-DR funds to
the fullest possible extent. The GLO will report on leverage funds in the DRGR system.
H. Protection of People and Property
1. Quality Construction Standards
The GLO will require both quality inspections and code compliance inspections on all
projects. Site inspections will be required on all projects to ensure quality and compliance
with building codes. The GLO will encourage and support subrecipients’ efforts to update
and strengthen local compliance codes to mitigate hazard risks due to sea level rise, high
winds, storm surge, and flooding where applicable. In the project application, subrecipients
will submit an explanation of both current and future planned codes to mitigate hazard
risks. The GLO will provide technical guidance on hazard mitigation code examples.
For reconstruction or new construction of residential buildings, the GLO will follow the
ENERGY STAR program for Green Building Standards. For rehabilitation of non-
substantially damaged residential buildings, the GLO will follow the guidelines to the
extent applicable as specified in the HUD CPD Green Building Retrofit Checklist. For
infrastructure projects, the GLO will encourage, to the extent practicable, implementation
of green building practices.
2. Housing Contractors Standards
The GLO will establish standards in the request for qualifications (RFQ) for housing
contractors and encourage subrecipients to do the same. The standards will include, but are
not limited to, information on the company’s (1) organizational structure and capabilities,
(2) ability to perform, (3) recent construction projects completed or underway over the past
5 years, (4) performance and payment bond capacity, (5) financial statements for the past
two years, (6) evidence of insurance coverage, and (7) business registrations, certifications,
and licenses.
To ensure full and open competition, subrecipients are required to follow federal
procurement and contract requirements outlined in 2 CFR 200.318 – 200.326. The GLO
will monitor subrecipient procurement. The GLO will require a warranty period post-
construction for housing; all work performed by the contractor will be guaranteed for a
period of 1 year.
I. Appeals Processes
The GLO responds to complaints and appeals in a timely and professional manner to maintain a
quality level of operations. The GLO’s appeals processes apply to appeals received from
homeowners, contractors, cities, counties, housing authorities, and other entities. The GLO will

Page 46 of 61
respond to homeowners by coordinating with the applicable subrecipient and/or housing contractor
to resolve issues.
A record of each complaint or appeal that the GLO receives is kept in an information file. When a
complaint or appeal is received, the GLO will respond to the complainant or appellant within 15
business days where practicable. For expediency, the GLO will utilize telephone communication
as the primary method of contact; email and postmarked letters will be used as necessary to
document conversations and transmit documentation.
Information about the complainant’s rights and how to file a complaint shall be printed on all
program applications, guidelines, the GLO public website, and subrecipients’ websites in all local
languages, as appropriate and reasonable. Procedures for appealing a GLO decision on a complaint
shall be provided to complainants in writing as part of the complaint response.
J. Dam and Levee Requirements
As stated in the Federal Register, Vol. 81, No. 224, Monday, November 21, 2016, CDBG-DR
funds are prohibited from being used to enlarge a dam or levee beyond the original footprint of the
structure that existed prior to the disaster event. The GLO will ensure that if subrecipients use
CDBG-DR funds for levees and dams, the subrecipients will (1) register and maintain entries
regarding such structures with the U.S. Army Corps of Engineers National Levee Database or
National Inventory of Dams, (2) ensure that the structure is admitted in the U.S. Army Corps of
Engineers PL 84–99 Program (Levee Rehabilitation and Improvement Program), and (3) ensure
the structure is accredited under the FEMA National Flood Insurance Program. The GLO will
upload into the DRGR system the exact location of the structure and the area served and protected
by the structure and maintain file documentation demonstrating that the grantee has conducted a
risk assessment prior to funding the flood control structure and that the investment includes risk
reduction measures.
K. Program Income
Any program income earned as a result of activities funded under this grant will be subject to
alternate requirements of 24 CFR 570.489(e), which defines program income. Program income
generated under individual contracts with the subrecipients will be returned to the GLO. At the
GLO’s discretion, program income could be allowed to remain with a community to continue
recovery efforts.
L. Monitoring Standards
The GLO provides program-wide oversight and monitoring activities for all applicable CDBG and
related federal requirements in its administration of the CDBG-DR Program. The GLO will
provide technical assistance to recipients from the application stage through the completion of the
projects to ensure that funds are appropriately used for the CDBG-DR activities, as well as meeting
one of the three national objectives.

Page 47 of 61
The GLO will monitor all contract expenditures for quality assurance and to prevent, detect, and
eliminate fraud, waste, and abuse as mandated by Executive Order (EO) RP 36, signed July 12,
2004, by the Governor of Texas. The GLO will particularly emphasize mitigation of fraud, abuse,
and mismanagement related to accounting, procurement, and accountability which may also be
investigated by the State Auditor’s Office (SAO). In addition, the GLO and the grantees are subject
to Uniform Guidance Standards of 2 CFR 200, which encompasses the review of compliance with
program requirements and the proper expenditure of funds by an independent Certified Public
Accountant (CPA) or by the SAO. Reports from the SAO’s office will be sent to the Office of the
Governor, the Legislative Committee, and the GLO.
The GLO has an internal audit staff that performs independent internal audits of programs and can
perform such audits on these programs and grantees. The GLO will utilize a monitoring plan to
specifically ensure that the recovery allocation is carried out in accordance with state and federal
laws, rules, and regulations, as well as the requirements set forth in the Federal Register Notices.
The monitoring plan will also include duplication of benefits review to ensure compliance with
the Stafford Act.
M. Broadband Infrastructure
As required by the Federal Register, Vol. 81, No. 224, Monday, November 21, 2016, any new
construction or substantial rehabilitation, as defined by 24 CFR 5.100, of a building with more
than four rental units will include installation of broadband infrastructure, as defined in 24 CFR
5.100, except where the grantee documents that: (i) the location of the new construction or
substantial rehabilitation makes installation of broadband infrastructure infeasible; (ii) the cost of
installing broadband infrastructure would result in a fundamental alteration in the nature of its
program or activity or in an undue financial burden; or (iii) the structure of the housing to be
substantially rehabilitated makes installation of broadband infrastructure infeasible.

Page 48 of 61
IV. State Administered Disaster Recovery Program
A. Action Plan
As required by the Federal Register, Vol. 82, No. 247, Wednesday, December 27, 2017, this Action
Plan must describe uses and activities for all funds that: (1) Are authorized under Title I of the
Housing and Community Development Act of 1974 (HCDA) or allowed by a waiver or alternative
requirement; and (2) respond to disaster-related impact to infrastructure, housing, and economic
revitalization in the most impacted and distressed areas.
The needs assessment, Section II, of this action plan was conducted for the development and
prioritization of recovery activities. In addition, the GLO consulted with affected citizens,
stakeholders, local governments, and public housing authorities to assess needs.
This Action Pan will outline the eligible affected areas and subrecipients, the methodology used
to distribute funds to those subrecipients, activities for which funding may be used, and outline
program requirements, including non-duplication of benefits.
B. Program Budget
Funds will be used solely for necessary expenses related to disaster relief, long-term recovery,
restoration of housing, infrastructure, and economic revitalization in the impacted and distressed
Texas counties as declared in DR-4332.
As required by the Federal Register, Vol. 82, No. 247, Wednesday, December 27, 2017, the GLO
will allocate 80 percent of the allocation to address unmet needs within Harris County, the HUD-
identified ‘most impacted and distressed’ area.
The GLO will ensure, as is required and identified in the Federal Register, that at least 70 percent
of the aggregate of CDBG-DR program funds will be used to support activities that benefit low-
and moderate-income persons.
To determine the allocation amounts for Harris County and the other most impacted and distressed
areas, 1 percent of state project delivery costs and 5 percent of state administration costs were
subtracted from the 80 percent for Harris County and the remaining 20 percent.
Table 12: Allocation Budget
HUD’s Most Impacted and Distressed
Area (Harris County) $43,465,600.00
Other Most Impacted and Distressed
Areas $10,866,400.00
State Project Delivery (1%)
$578,000.00
State Administration (5%)
$2,890,000.00
Total Allocation
$57,800,000.00

Page 49 of 61
C. Use of Funds
HUD has identified Harris County as the “most impacted and distressed” areas impacted by
Hurricane Harvey and has required that at least 80 percent of the allocation must address unmet
needs within the County. The remaining 20 percent will address unmet needs within “most
impacted and distressed” areas determined by the GLO through the unmet needs assessment in
Section II of this Action Plan. Due to the limited amount of funds available with this first allocation
and the tremendous amount of unmet needs in the impacted areas, the GLO has identified Aransas,
Nueces, and Refugio Counties as the next “most impacted and distressed” counties. The State of
Texas is expected to receive additional CDBG-DR allocations for the long-term recovery from
Hurricane Harvey.
Based on the analysis of the unmet needs assessment in Section II of this Action Plan and after
consultation with Harris County officials, this first allocation of funds for Harris County will be
used for residential buyouts to prevent as many homes as possible from rebuilding in harm’s way.
According to the National Flood Insurance Program data, Harris County had the highest number
of properties, over 3,000, that were flooded during Hurricane Harvey and had been flooded at least
one prior time.
Aransas, Nueces, and Refugio Counties experienced widespread devastation from Hurricane
Harvey and the category 4 winds, storm surge, and flooding associated with the hurricane’s
landfall, as evidenced by the increased unemployment rates following Hurricane Harvey.
Hurricane Harvey destroyed hundreds of affordable rental units making the availability of
workforce housing all but nonexistent. Because of the unique economy and workforce needs in
the region, Aransas, Nueces and Refugio Counties have been identified as “most impacted and
distressed” for the purposes of this allocation. To begin resolving this issue the state will administer
an affordable rental set aside in these counties.
1. Harris County Residential Buyout Program
The Harris County Residential Buyout Program will be administered in Harris County.
Residential Buyout Program guidelines will be developed in accordance with CDBG-DR
requirements and regulations to set maximum assistance amounts, target area locations, and
additional eligibility requirements. At a minimum, the Residential Buyout program guidelines
will include the following criteria:
a. Allocation for Activity: $35,465,600 to benefit approximately 175 households.
b. Eligible Applicants: Homeowners whose primary residences sustained flooding
damage from Hurricane Harvey.
c. Eligibility Criteria:
i. Home must have been owner-occupied at the time of the storm
ii. Home must have served as primary residence
iii. Home must be owned by LMI household
iv. Home must be located in Harris County
d. National Objective: Low and moderate income

Page 50 of 61
Eligible Activities: Acquisition buyout of residential property, clearance and demolition,
and relocation payment and assistance.
The proposed program start date is 30 days after HUD’s approval of this Action Plan. The
proposed end date is two years from the start date of the program.
2. Harris County Partial Repair and Essential Power for Sheltering Program
The Harris County Partial Repair and Essential Power for Sheltering Program is currently
being administered by the GLO under FEMA Public Assistance (PA). The program provides
immediate, temporary repairs to homes that sustained less than $17,000 in FEMA Verified
Loss. As a PA program, FEMA will cover 90% of the expenses, and the GLO will use up to
$8,000,000 of this allocation to cover repairs conducted on homes within Harris County.
a. Allocation for Activity: $8,000,000
b. Eligible Applicants: GLO Project Worksheet
c. Eligible Activity: Urgent Need
3. Affordable Rental Recovery Program
a. Allocation for Activity: $10,866,400
b. Multifamily projects including multifamily repair and rehabilitation;
c. Eligible Activity: Rehabilitation and reconstruction of affordable multi-family
housing projects
d. Eligibility Criteria:
i. Development must meet CDBG-DR eligibility requirements.
ii. Development must be located in Aransas, Nueces, and Refugio Counties.
iii. A minimum of 51% of the units must be restricted for ten or more years to
low to moderate income (LMI) individuals earning 80% or less of the Area
Median Family Income (AMFI) at affordable rents. The rents must comply
with High HOME Investment Partnership (HOME) Rents and other existing
Land Use Restriction Agreement (LURA) restrictions, if applicable.
iv. Property Types: Multifamily Rental Development is eight or more rental
units under common ownership.
v. The Affordable Rental Program Notice of Funding Availability (NOFA)
will clearly establish the application process and acceptance period,
threshold criteria (including applicable building codes), selection criteria,
and the award process.
vi. Project construction must be completed within 18 months of the effective
date of the contract, unless otherwise extended.
e. National Objective: Low and moderate income
The proposed program start date is 30 days after HUD’s approval of this Action Plan. The
proposed end date is three years from the start date of the program.

Page 51 of 61
D. Ineligible activities
Ineligible activities identified in the Federal Register, Vol. 81, No. 224, Monday, November 21,
2016, are the use of CDBG‐DR for forced mortgage payoff, construction of dam/levee beyond
original footprint, incentive payments to households that move to disaster‐impacted floodplains,
assistance to privately owned utilities, not prioritizing assistance to businesses that meet the
definition of a small business, or assistance for second homes and activities identified in 24 CFR
570.207. All activities and uses authorized under Title I of the Housing and Community
Development Act of 1974, allowed by waiver, or published in the Federal Register, Vol. 81, No.
224, Monday, November 21, 2016, are eligible. The GLO will not limit any eligible activities
beyond what is specifically excluded by HUD to allow communities as much flexibility as
possible.
E. Administrative Funds
State administrative costs will not exceed five percent. Planning and administrative costs combined
will not exceed 20 percent. The provisions outlined under 42 U.S.C. 5306(d) and 24 CFR
§570.489(a)(1)(i) and (iii) will not apply to the extent that they cap state administration
expenditures and require a dollar-for-dollar match of state funds for administrative costs exceeding
$100,000. Pursuant to 24 CFR §58.34(a)(3), except for applicable requirements of 24 CFR §58.6,
administrative and management activities are exempt activities under this Action Plan. Once
contracted, the GLO will allow the drawdown of pre-agreement costs associated with eligible
disaster recovery activities dating back to the date of the disaster for subrecipients and the GLO
with appropriate documentation.
No disaster recovery assistance will be considered with respect to any part of a disaster loss that is
reimbursable by the Federal Emergency Management Agency (FEMA), the Army Corps of
Engineers (USACE), insurance, or another source due in part to the restrictions against duplication
of benefits outlined in this Action Plan. An activity underway prior to the Presidential Disaster
Declaration will not qualify unless the disaster directly impacted said project.
F. Location
All CDBG-DR funded activities under this Action Plan will occur within the disaster-declared
counties of FEMA DR-4332. For the purpose of this Action Plan, counties that received FEMA
disaster declarations for emergency protective measures only (Category B) including direct federal
assistance, under the Public Assistance program are not included in the 49 CDBG-DR eligible
counties.
G. Mitigation Measures
The GLO will encourage subrecipients to incorporate preparedness and mitigation measures into
rebuilding activities. This helps to ensure that post-recovery communities are safer and stronger
than prior to the disaster. Incorporation of these measures also reduces costs in recovering from
future disasters. Mitigation measures that are not incorporated into those rebuilding activities must

Page 52 of 61
be a necessary expense related to disaster relief, long-term recovery, and restoration of
infrastructure, housing, or economic revitalization that responds to declared disaster FEMA DR-
4332.
H. Use of Urgent Need
Each subrecipient receiving Hurricane Harvey CDBG-DR funds will document how all activities
or projects funded under the urgent need national objective respond to a disaster-related impact
identified by the subrecipients. The CDBG certification requirements for documentation of urgent
need, located at 24 CFR 570.208(c) and 24 CFR 570.483(d), are waived for the grants under this
notice until 24 months after HUD first obligates funds to the grantee.
It is anticipated that the use of the urgent need national objective will be limited. At least 70 percent
of the aggregate of CDBG-DR program funds will be used to support activities that benefit low-
and moderate-income persons.

Page 53 of 61
V. Citizen Participation
The citizen participation plan for the Hurricane Harvey allocation as required by the Federal
Register, Vol. 82, No. 247, Wednesday, December 27, 2017, will provide
a reasonable
opportunity of at least fourteen
(14) days
for citizen comment and ongoing citizen access
to information about the use of grant funds.
Before the GLO adopts the Action Plan for this grant or any substantial amendment to this
grant, the GLO will publish the proposed plan or amendment on
http://www.glo.texas.gov/recovery/reporting/action-plans/index.html, the GLO’s main
website and will cross-reference with additional agency websites: TexasRebuilds.org and
TexasRebuilds.com.
The GLO and/or subrecipients will notify affected citizens through electronic mailings, press
releases, statements by public officials, media advertisements, public service
announcements, newsletters, contacts with neighborhood organizations, and/or through
social media.
The GLO will ensure that all citizens have equal access to information about the programs,
including persons with disabilities (vision and hearing impaired) and limited English
proficiency (LEP). A Spanish version of the Action Plan will be available. The GLO
consulted the “
Final Guidance to Federal Financial Assistance Recipients Regarding Title VI,
Prohibition Against National Origin Discrimination Affecting Limited English Proficient
Persons,” published on January 22, 2007, in the Federal Register (72 FR 2732), in order to
comply with citizen participation requirements.
Upon subsequent publication of the Action Plan or substantial amendments, the GLO will
provide a reasonable opportunity of at least fourteen (14) days and have a method for receiving
comments.
The GLO will take comments via USPS mail, fax, email, or through the GLO’s website:
Texas General Land Office
Community Development and Revitalization
P.O. Box 12873
Austin, TX 78711-2873
Fax: 512-475-5150
Email: [email protected]
Online Form:
http://www.glo.texas.gov/recovery/reporting/action-
plans/index.html
A. Public Website
The GLO will make the following items available on
www.glo.texas.gov/recovery
: (1) the
Action Plan (including all amendments); each Quarterly Performance Report (QPR) as created
using the Disaster Recovery Grant Reporting System (DRGR) system; (2) procurement,

Page 54 of 61
policies and procedures; (3) executed CDBG-DR contracts; and (4) status of services or goods
currently being procured by the GLO (e.g., phase of the procurement, requirements for
proposals, etc.).
B. Consultation
The GLO consulted and conducted outreach for the 49 impacted counties. The GLO
consultation and outreached included the following:
The GLO participated in all impacted counties roundtable meetings coordinated
through the Governor’s Commission to Rebuild Texas.
Roundtable meetings allowed all impacted cities and counties to identify needs
following Hurricane Harvey.
Elected Officials Meetings held included the following:
09/12/2017
Meeting in Harris County with state legislative delegation, Harris County officials,
and city of Houston officials.
09/18/2017
Meeting in Jefferson County with state and federal legislators, county officials, and
city officials.
09/18/2017
Meeting in Orange County with state and federal legislators, county officials, and
city officials.
09/28/2017
Meeting in Liberty County with state elected officials, county officials, and city
officials.
09/28/2017 Meeting in Sour Lake with local officials.
09/28/2017 Meeting in Hardin County with state legislators, county officials, and city officials.
10/04/2017 Meeting in Baytown with city staff.
10/10/2017
Meeting in Wharton County with local officials, Matagorda County, and Brazoria
County officials.
11/16/2017 Meeting in Victoria County with local officials.
11/21/2017 Meeting in Chambers County with city and county officials and staff.
11/21/2017 Meeting in Newton County with county and state officials.
11/28/2017 Meeting in Fort Bend County with federal, state, county, and city officials.

Page 55 of 61
The GLO provided additional outreach through updates provided as part of legislative
testimony for standing state legislative committees. The GLO held conference calls to
include members of the legislature, county judges and mayors providing updates on
Hurricane Harvey efforts.
Stakeholder/Partner Meetings – Outreach
• Local officials weekly conference calls
• State elected officials weekly conference calls
• Councils of Governments (COGs) bi-weekly call meetings
• Texas Association of Regional Councils (TARC) briefings
• Unified Federal Review (UFR) State Agencies meetings
• University of Texas meetings
• Houston-Galveston Area Council (H-GAC)
• Coastal Bend Council of Governments (CBCOG)
• South East Texas Regional Planning Commission (SETRPC)
• Capital Area Council of Governments (CAPCOG)
• Deep East Texas Councils of Governments (DETCOG)
• Golden Crescent Regional Planning Commission (GCRPC)
• Appleseed
• Texas Homeless Network
• Robinhood Foundation
• OneStar Foundation
• Texas Association of Builders
• American Planning Association of Texas
• Texas Apartment Association
• Clayton Homes
• Habitat for Humanity Texas
• Kasita
• Housing Strike Teams
• CHRISTUS Health
• American Red Cross
• Various state and federal agencies
Websites
September 20, 2017: Created www.TexasRebuilds.com website for information
related to Hurricane Harvey for individuals and local governments related to short
term and long-term housing.
Additional information is posted on TexasRebuilds.org and main GLO website.
Newsletters / Emails / Press Releases / Conference Calls
Prior to Hurricane Harvey’s landfall, GLO emailed a recovery checklist to all

Page 56 of 61
entities in the projected impact area.
Following landfall, the GLO has provided informative disaster recovery emails,
hosted conference calls and provided weekly newsletters to eligible cities,
counties, and councils of government located in the disaster-declared counties.
This included Texas state representatives, Texas state senators, and congressional
representatives.
C. Consideration of Public Comments
The GLO will consider all written comments regarding the Action Plan or any substantial
amendment. A summary of the comments and the GLO's response to each located in
Appendix C must be submitted to HUD with the Action Plan or substantial amendment.
D. Citizen Complaints
The GLO will provide a timely written response to every citizen complaint. The response will be
provided within fifteen (15) working days of the receipt of the complaint, if practicable.
E. Substantial Amendment
As additional information and funding becomes available through the grant administration process,
amendments to this Action Plan are expected. Prior to adopting any substantial amendment to this
Action Plan, the GLO will publish the proposed plan or amendment on the GLO’s official website
and will afford citizens, affected local governments, and other interested parties a reasonable
opportunity to examine the plan or amendment’s contents. At a minimum, the following
modifications will constitute a substantial amendment:
• A change in program benefit or eligibility criteria;
• The allocation or reallocation of more than $1 million; or
• The addition or deletion of an activity.
F. Non-substantial Amendment
The GLO will notify HUD when it makes any plan amendment that is not substantial. HUD will
be notified at least five business days before the amendment becomes effective. HUD will
acknowledge receipt of the notification of non-substantial amendments via email within five (5)
business days.
G. Waivers
The Appropriations Act authorizes the Secretary of HUD to waive or specify alternative
requirements for any provision of any statute or regulation that the Secretary administers in
connection with the obligation by the Secretary, or use by the recipient, of these funds and
guarantees, except for requirements related to fair housing, nondiscrimination, labor standards,

Page 57 of 61
and the environment (including requirements concerning lead-based paint), upon: (1) A request by
the grantee explaining why such a waiver is required to facilitate the use of such funds or
guarantees; and (2) a finding by the Secretary that such a waiver would not be inconsistent with
the overall purpose of the Housing and Community Development (HCD) Act. Regulatory waiver
authority is also provided by 24 CFR 5.110, 91.600, and 570.5.
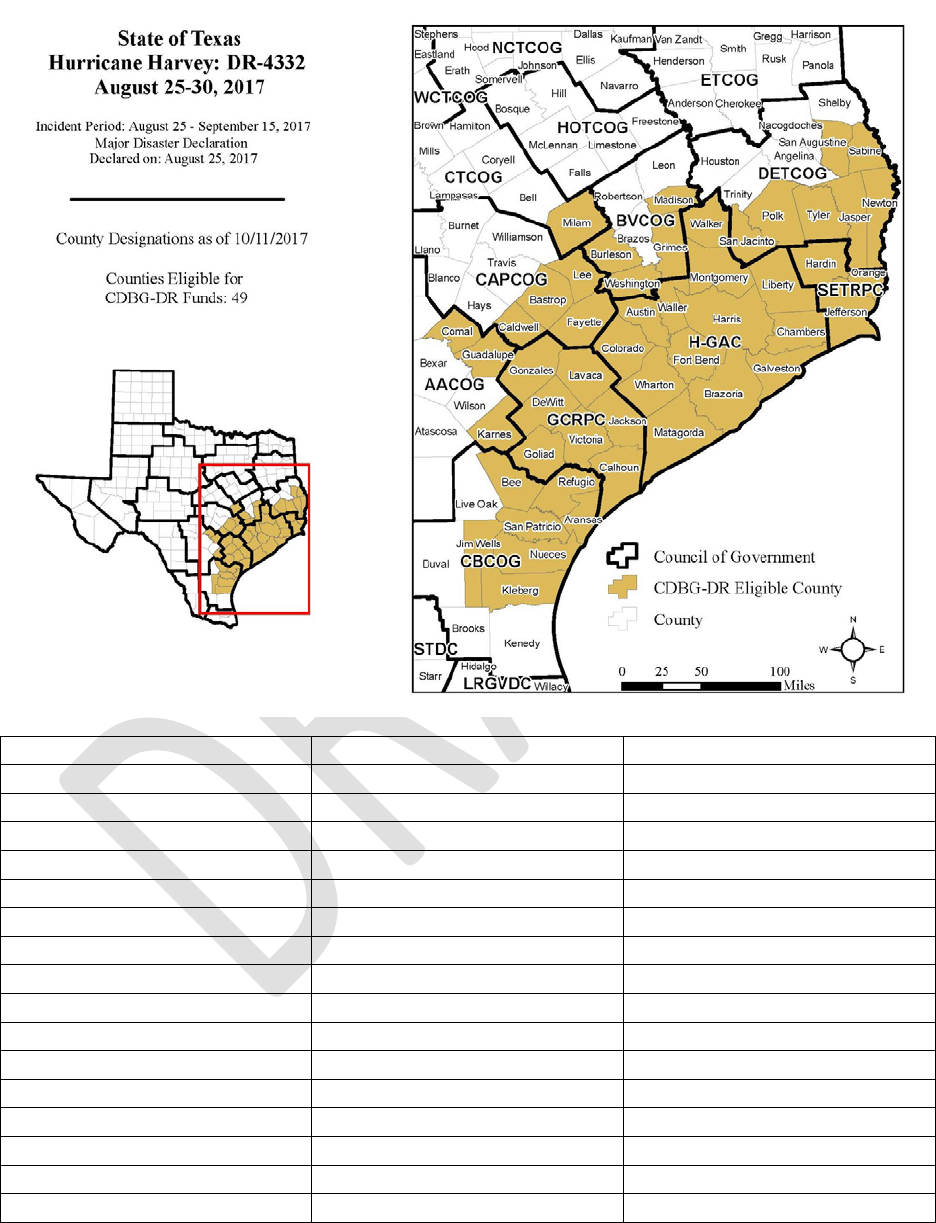
Page 58 of 61
VI. Appendix A – CDBG-DR Eligible Counties
Aransas
Grimes
Newton
Austin
Guadalupe
Nueces
Bastrop
Hardin
Orange
Bee
Harris
Polk
Brazoria
Jackson
Refugio
Burleson
Jasper
Sabine
Caldwell
Jefferson
San Augustine
Calhoun
Jim Wells
San Jacinto
Chambers
Karnes
San Patricio
Colorado
Kleberg
Tyler
Comal
Lavaca
Victoria
DeWitt
Lee
Walker
Fayette
Liberty
Waller
Fort Bend
Madison
Washington
Galveston
Matagorda
Wharton
Goliad
Milam
Gonzales
Montgomery

Page 59 of 61
VII. Appendix B – Certifications
24 CFR 91.325 is waived. Each State receiving a direct allocation under this notice must make the
following certifications with its Action Plan:
a. The grantee certifies that it has in effect and is following a residential anti‐displacement and
relocation assistance plan in connection with any activity assisted with funding under the CDBG
program.
b. The grantee certifies its compliance with restrictions on lobbying required by 24 CFR part 87,
together with disclosure forms, if required by part 87.
c. The grantee certifies that the action plan for Disaster Recovery is authorized under state and
local law (as applicable) and that the grantee, and any entity or entities designated by the grantee,
and any contractor, subrecipient, or designated public agency carrying out an activity with CDBG‐
DR funds, possess(es) the legal authority to carry out the program for which it is seeking to fund,
in accordance with applicable HUD regulations and this notice. The grantee certifies that activities
to be undertaken with funds under this notice are consistent with its action plan.
d. The grantee certifies that it will comply with the acquisition and relocation requirements of the
URA, as amended, and implementing regulations at 49 CFR part 24, except where waivers or
alternative requirements are provided for in this notice.
e. The grantee certifies that it will comply with section 3 of the Housing and Urban Development
Act of 1968 (12 U.S.C. 1701u), and implementing regulations at 24 CFR part 135.
f. The grantee certifies that it is following a detailed citizen participation plan that satisfies the
requirements of 24 CFR 91.105 or 91.115, as applicable (except as provided for in notices
providing waivers and alternative requirements for this grant). Also, each UGLG receiving
assistance from a state grantee must follow a detailed citizen participation plan that satisfies the
requirements of 24 CFR 570.486 (except as provided for in notices providing waivers and
alternative requirements for this grant).
g. Each state receiving a direct award under this notice certifies that it has consulted with affected
UGLGs in counties designated in covered major disaster declarations in the non‐entitlement,
entitlement, and tribal areas of the state in determining the uses of funds, including the method of
distribution of funding, or activities carried out directly by the state.
h. The grantee certifies that it is complying with each of the following criteria:
1. Funds will be used solely for necessary expenses related to disaster relief, long‐ term
recovery, restoration of infrastructure and housing and economic revitalization in the most
impacted and distressed areas for which the President declared a major disaster in 2017
pursuant to the Robert T. Stafford Disaster Relief and Emergency Assistance Act of 1974
(42 U.S.C. 5121 et seq.) but prior to September 29, 2016.

Page 60 of 61
2. With respect to activities expected to be assisted with CDBG‐DR funds, the Action Plan
has been developed so as to give the maximum feasible priority to activities that will benefit
low‐ and moderate‐income families.
3. The aggregate use of CDBG‐DR funds shall principally benefit low‐ and moderate‐
income families in a manner that ensures that at least 70 percent (or another percentage
permitted by HUD in a waiver published in an applicable Federal Register notice) of the
grant amount is expended for activities that benefit such persons.
4. The grantee will not attempt to recover any capital costs of public improvements assisted
with CDBG‐DR grant funds, by assessing any amount against properties owned and
occupied by persons of low‐ and moderate‐income, including any fee charged or
assessment made as a condition of obtaining access to such public improvements, unless:
(a) Disaster recovery grant funds are used to pay the proportion of such fee or
assessment that relates to the capital costs of such public improvements that are
financed from revenue sources other than under this title; or
(b) For purposes of assessing any amount against properties owned and occupied
by persons of moderate income, the grantee certifies to the Secretary that it lacks
sufficient CDBG funds (in any form) to comply with the requirements of clause (a).
i. The grantee certifies that the grant will be conducted and administered in conformity with Title
VI of the Civil Rights Act of 1964 (42 U.S.C. 2000d) and the Fair Housing Act (42 U.S.C. 3601–
3619) and implementing regulations, and that it will affirmatively further fair housing.
j. The grantee certifies that it has adopted and is enforcing the following policies, and, in addition,
states receiving a direct award must certify that they will require UGLGs that receive grant funds
to certify that they have adopted and are enforcing:
1. A policy prohibiting the use of excessive force by law enforcement agencies within its
jurisdiction against any individuals engaged in non‐violent civil rights demonstrations; and
2. A policy of enforcing applicable state and local laws against physically barring entrance
to or exit from a facility or location that is the subject of such nonviolent civil rights
demonstrations within its jurisdiction.
k. The grantee certifies that it has adopted and is enforcing the following policies, and, in addition,
states receiving a direct award must certify that they will require UGLGs that receive grant funds
to certify that they have adopted and are enforcing:
1. A policy prohibiting the use of excessive force by law enforcement agencies within its
jurisdiction against any individuals engaged in nonviolent civil rights demonstrations; and
2. A policy of enforcing applicable state and local laws against physically barring entrance
to or exit from a facility or location that is the subject of such nonviolent civil rights
demonstrations within its jurisdiction.

Page 61 of 61
l. The grantee certifies that it (and any subrecipient or administering entity) currently has or will
develop and maintain the capacity to carry out disaster recovery activities in a timely manner and
that the grantee has reviewed the requirements of this notice and requirements of the
Appropriations Act applicable to funds allocated by this notice, and certifies to the accuracy of its
certification documentation referenced at A.1.a. under section VI and its risk analysis document
referenced at A.1.b. under section VI.
m. The grantee certifies that it will not use CDBG‐DR funds for any activity in an area identified
as flood prone for land use or hazard mitigation planning purposes by the state, local, or tribal
government or delineated as a Special Flood Hazard Area in FEMA’s most current flood advisory
maps, unless it also ensures that the action is designed or modified to minimize harm to or within
the floodplain, in accordance with Executive Order 11988 and 24 CFR part 55. The relevant data
source for this provision is the state, local, and tribal government land use regulations and hazard
mitigation plans and the latest issued FEMA data or guidance, which includes advisory data (such
as Advisory Base Flood Elevations) or preliminary and final Flood Insurance Rate Maps.
n. The grantee certifies that its activities concerning lead‐based paint will comply with the
requirements of 24 CFR part 35, subparts A, B, J, K, and R.
o. The grantee certifies that it will comply with environmental requirements at 24 CFR part 58.
p. The grantee certifies that it will comply with applicable laws.
